October 2nd, 2012
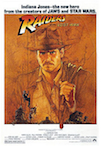
There was a wide variety of new releases to reach the top ten on the Blu-ray Sales Chart this week. Indiana Jones Blu-ray Box Set opened in first place with 239,000 units / $15.55 million, which is excellent for a box set.
More...
September 18th, 2012
It's quite a busy week on the home market front, but most of the new releases are TV on DVD. This includes Modern Family: Season Three on DVD or Blu-ray, which is a contender for Pick of the Week. The best limited release of the week is The Best Exotic Marigold Hotel on DVD or Blu-ray, while the Indiana Jones: The Complete Adventures Blu-ray Box Set is also a contender for Pick of the Week. However, in the end I went with The Cabin in the Woods Blu-ray, which is practically the only first-run release of the week.
More...
September 17th, 2012
Indiana Jones makes its Blu-ray debut this week in a massive five-disc box set. I swear I've reviewed all four films in the past, but I can only find the review for Kingdom of the Crystal Skull. Since this is one of the most famous franchises of all time, and it has been released on the home market repeatedly, I think I can spend less time talking about the movies and more about the Blu-rays.
More...
September 10th, 2012
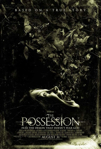
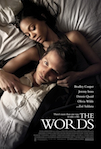
Yuck. The overall box office this past weekend was not only the worst of the year so far, but it was the worst we've seen in more than a decade. Not only did the box office have a decade of inflation, but also a decade of population growth, which makes this result even more depressing. The Possession was the only bright spot in the top ten. Both The Words and The Cold Light of Day missed the Mendoza Line during their opening weekend. Overall, the box office plummeted 35% to just $67 million. Compared to last year, the box office fell by 17%. It's a disaster. 2012 is still ahead of 2011 by 3.3% at $7.70 billion to $7.45 billion. Things will have to get better next weekend, so hopefully we will never have to think about this weekend again.
More...
September 9th, 2012
One statistic suffices to sum up this weekend at the box office: based on estimates received so far, the weekend ranks as the 5th-worst weekend for total box office receipts since January, 2000 (see full chart here). While that position will improve when we get complete numbers on Monday, there's a good chance this will end up as the worst weekend since 2001, even though ticket prices have risen substantially since then. The two marks that industry watchers should look out for are the $67.5 million weekend of September 5, 2003 and the $67.9 million weekend of September 5, 2008. Unsurprisingly, the top film at the box office this weekend is the same as last weekend: The Possession is set for about $9.5 million in its second outing. The Words is the top opener, with about $5 million in 2,801 theaters -- certainly a disappointment, although CBS Films is hoping for good legs thanks to its adult-skewing demographic.
More...
September 6th, 2012
The weekend after the Labor Day long weekend is often the worst weekend of the entire year at the box office. This certainly seems to be the case this year. There are two wide releases, or to be more accurate, one wide release, The Words, and one semi-wide release, The Cold Light of Day. Neither film is expected to top $10 million. The last time the number one film over the weekend earned less than $10,000,000 was way back in 2008 with the release of Bangkok Dangerous, which opened in the weekend after Labor Day. There is a slim chance The Words will earn less than Bangkok Dangerous did. This weekend last year wasn't actually pretty good with Contagion dominating the chart. There's almost no chance any film opening this weekend will match the $22.40 million that film earned. The top three films combined probably won't match that figure. 2012 will start the autumn with a pretty big fall.
More...