Barry Pepper

Best known as a Supporting Actor based on credits in that role in 20 films, with $2,968,252,837 worldwide aggregate box office (rank #432)
Best-known acting roles: Voice of SHOWTIME® All Access (Creed III), "Lucky" Ned Pepper (True Grit), Private Jackson (Saving Private Ryan), Vince (Maze Runner: The Scorch Trials), Fuller (The Lone Ranger)
Best-known technical roles: Trigger Point (Executive Producer)
Most productive collaborators: Alexandre Aja, Kaya Scodelario, Michael Rasmussen, Justin Haythe, Matt Damon
Born: April 4, 1970 (54 years old)
                                    

  1. Summary
  2. News
  3. Acting Credits
  4. Technical Credits

Career Summary


  MoviesDomestic
Box Office
International
Box Office
Worldwide
Box Office
As an ActorSupporting20$1,356,935,970$1,611,316,867$2,968,252,837
Leading4$41,083,324$52,938,614$94,021,938
Lead Ensemble Member3$12,219,722$861,289$13,081,011
(Unclassified)4$26,262,542$24,015,330$50,277,872
In Technical RolesExecutive Producer1$29,262$0$29,262
Producer1$0$0$0

Career Trend

This graph shows Barry Pepper’s score on our annual analysis of leading stars at the box office. The Star Score represents points assigned to each of the leading stars of the top 100 movies (based on box office) in the current year and two preceding years. For appearing in the number one movie in a year a star gets 100 points, the number two movie 99 points and so on..

Latest Ranking on Selected Box Office Record Lists


Featured Blu-ray and DVD Review: Crawl

October 14th, 2019

Crawl

Crawl is the latest horror film from director Alexandre Aja. It’s a Nature Horror film, a subgenre that usually features killer animals or extreme weather. This one has both. Can the film mix these two threats in an effective way? Or is it just get silly trying to combine the two? More...

Crawl Trailer

May 3rd, 2019

Horror movie starring Kaya Scodelario and Barry Pepper opens July 12 ... Full Movie Details. More...

2013 Preview: July

July 1st, 2013

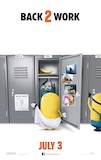
For the most part, June was a really strong month at the box office with nearly every film either matching expectations, or at least coming close enough to call it a victory. Looking forward, there are a dozen films opening wide in July, more or less. One of them, The Smurfs 2, is opening on a Wednesday, so I'm going to hold off talking about that movie till the August preview. Kevin Hart: Let Me Explain is opening in less than 1000 theaters, but it has a shot at reaching the top ten during its opening weekend. If we include both of them, there are twelve films, but I think it is better to stick with the ten truly wide, truly July openings. Of these, Despicable Me 2 is clearly going to be the biggest hit at the box office. It could become the second biggest hit of the year so far. It is not the only film that could be a $100 million hit. In fact, there are six films opening in July that I think have a better than 50% chance of reaching that level. There is currently only one film that I think won't at least become a midlevel hit. By comparison in 2012, there were three $100 million movies, led by The Dark Knight Rises, but the rest of the new releases struggled. There's no chance any movie opening this month will top $400 million, in fact, it is quite possible no film will get to $300 million. That said, 2013 has a lot better depth, so it might come out on top in the end. More...

All Acting Credits


Register with The Numbers for free to customize this chart.

Release
Date
TitleRoleDomestic
Box Office
International
Box Office
Worldwide
Box Office
Feb 23, 2024Bring Him to Me $2,301$52,848$55,149
Mar 3, 2023Creed III Voice of SHOWTIME… $156,248,615$118,200,000$274,448,615
Jun 9, 2021Awake $149,558$149,558
Apr 16, 2021Trigger Point Nicolas Shaw $29,262$29,262
Jul 17, 2020Nabarvené ptáče Mitka $1,460$655,134$656,594
Sep 20, 2019Running with the Devil The Boss $59,730$59,730
Jul 12, 2019Crawl Dave Keller $39,014,193$52,706,297$91,720,490
Jan 26, 2018Maze Runner: The Death… Vince $58,032,443$207,846,093$265,878,536
Feb 24, 2017Bitter Harvest Yaroslav $557,241$48,921$606,162
Jan 13, 2017Monster Trucks Sheriff Rick $33,370,166$28,272,632$61,642,798
Sep 18, 2015Maze Runner: The Scorc… Vince $81,697,192$228,868,970$310,566,162
Oct 10, 2014Kill the Messenger Russell Dodson $2,450,846$4,205,859$6,656,705
Jul 2, 2013The Lone Ranger Fuller $89,302,115$170,700,000$260,002,115
Feb 22, 2013Snitch Agent Cooper $42,930,462$14,977,272$57,907,734
Jan 18, 2013Broken City Jack Valliant $19,701,164$17,413,813$37,114,977
Dec 22, 2010True Grit "Lucky" Ned Pepper $171,243,005$81,033,923$252,276,928
Dec 17, 2010Casino Jack Michael Scanlon $2,039,869$232,317$2,272,186
Dec 19, 2008Seven Pounds Dan $69,951,824$96,665,504$166,617,328
Nov 3, 2006Unknown Rancher Shirt/Wil… $26,403$3,328,645$3,355,048
Oct 20, 2006Flags of Our Fathers Mike Strank $33,602,376$30,055,565$63,657,941
Dec 14, 2005Los tres entierros de … Mike Norton $5,027,684$8,426,790$13,454,474
Sep 23, 2005Magnificent Desolation John Young $34,126,126$5,720,770$39,846,896
Dec 19, 200225th Hour Frank $13,084,595$12,259,895$25,344,490
Oct 11, 2002Knockaround Guys Matty Demaret $11,660,180$759,520$12,419,700
Mar 1, 2002We Were Soldiers Joe Galloway $78,120,196$36,538,066$114,658,262
May 12, 2000Battlefield Earth: A S… Jonnie Goodboy Tyler $21,471,685$8,253,978$29,725,663
Dec 10, 1999The Green Mile Dean Stanton $136,801,374$153,900,000$290,701,374
Nov 20, 1998Enemy of the State Pratt $111,549,836$139,100,000$250,649,836
Jul 24, 1998Saving Private Ryan Private Jackson $216,335,085$268,700,000$485,035,085
Jan 9, 1998Firestorm Packer $8,123,860$8,123,860
 
Averages $51,303,627$60,326,146$104,187,789
Totals 30 $1,436,501,558$1,689,132,100$3,125,633,658


Leading or Lead Ensemble Roles


Register with The Numbers for free to customize this chart.

Release
Date
TitleOpening
Weekend
Maximum
Theaters
Domestic
Box Office
Worldwide
Box Office
Domestic
Share
Feb 23, 2024Bring Him to Me $1,47512$2,301$55,1494.2%
Apr 16, 2021Trigger Point $29,26277$29,262$29,262100.0%
Jul 12, 2019Crawl $12,005,2103,170$39,014,193$91,720,49042.5%
Feb 24, 2017Bitter Harvest $219,357127$557,241$606,16291.9%
Dec 17, 2010Casino Jack $34,52860$2,039,869$2,272,18689.8%
Oct 11, 2002Knockaround Guys $5,016,8521,806$11,660,180$12,419,70093.9%
 
Averages $2,884,447875$8,883,841$17,850,49270.4%
Totals 6 $53,303,046$107,102,949


Supporting Roles


Register with The Numbers for free to customize this chart.

Release
Date
TitleOpening
Weekend
Maximum
Theaters
Domestic
Box Office
Worldwide
Box Office
Domestic
Share
Mar 3, 2023Creed III $58,370,0074,007$156,248,615$274,448,61556.9%
Jun 9, 2021Awake $149,558
Jul 17, 2020Nabarvené ptáče $4528$1,460$656,5940.2%
Sep 20, 2019Running with the Devil $59,730
Jan 26, 2018Maze Runner: The Death… $24,167,0113,793$58,032,443$265,878,53621.8%
Jan 13, 2017Monster Trucks $10,950,7053,119$33,370,166$61,642,79854.1%
Sep 18, 2015Maze Runner: The Scorc… $30,316,5103,792$81,697,192$310,566,16226.3%
Oct 10, 2014Kill the Messenger $941,809427$2,450,846$6,656,70536.8%
Jul 2, 2013The Lone Ranger $29,210,8493,904$89,302,115$260,002,11534.3%
Feb 22, 2013Snitch $13,167,6072,511$42,930,462$57,907,73474.1%
Jan 18, 2013Broken City $8,268,9082,622$19,701,164$37,114,97753.1%
Dec 22, 2010True Grit $24,830,4433,464$171,243,005$252,276,92867.9%
Dec 19, 2008Seven Pounds $14,851,1362,758$69,951,824$166,617,32842.0%
Oct 20, 2006Flags of Our Fathers $10,245,1902,375$33,602,376$63,657,94152.8%
Sep 23, 2005Magnificent Desolation $503,25382$34,126,126$39,846,89685.6%
Mar 1, 2002We Were Soldiers $20,212,5433,143$78,120,196$114,658,26268.1%
May 12, 2000Battlefield Earth: A S… $11,548,8983,307$21,471,685$29,725,66372.2%
Dec 10, 1999The Green Mile $18,017,1522,878$136,801,374$290,701,37447.1%
Nov 20, 1998Enemy of the State $20,038,5732,517$111,549,836$250,649,83644.5%
Jul 24, 1998Saving Private Ryan $30,576,1042,807$216,335,085$485,035,08544.6%
 
Averages $18,123,1752,640$75,385,332$148,412,64249.0%
Totals 20 $1,356,935,970$2,968,252,837

Latest Ranking on All Acting Box Office Record Lists


RecordRankAmount
Top 100 Stars in Leading Roles at the Domestic Box Office (Rank 2,201-2,300) 2,225 $53,303,046
Top 100 Stars in Supporting Roles at the Domestic Box Office (Rank 301-400) 356 $1,356,935,970
Top Live Action Stars at the Domestic Box Office (Rank 401-500) 498 $1,402,375,432
Top Above the Line Stars at the Domestic Box Office (Rank 701-800) 794 $651,600,326
Top Below the Line Stars at the Domestic Box Office (Rank 501-600) 594 $724,512,564
Top Stars at the Domestic Box Office (Rank 601-700) 659 $1,436,501,558
Top 100 Stars in Leading Roles at the International Box Office (Rank 2,101-2,200) 2,192 $53,799,903
Top 100 Stars in Supporting Roles at the International Box Office (Rank 501-600) 578 $1,611,316,867
Top Live Action Stars at the International Box Office (Rank 501-600) 594 $1,683,411,330
Top Above the Line Stars at the International Box Office (Rank 701-800) 784 $879,964,910
Top Below the Line Stars at the International Box Office (Rank 1,301-1,400) 1,336 $779,431,090
Top Stars at the International Box Office (Rank 801-900) 807 $1,689,132,100
Top 100 Stars in Leading Roles at the Worldwide Box Office (Rank 2,101-2,200) 2,190 $107,102,949
Top 100 Stars in Supporting Roles at the Worldwide Box Office (Rank 401-500) 432 $2,968,252,837
Top Live Action Stars at the Worldwide Box Office (Rank 501-600) 518 $3,085,786,762
Top Above the Line Stars at the Wordwide Box Office (Rank 701-800) 781 $1,531,565,236
Top Below the Line Stars at the Worldwide Box Office (Rank 801-900) 871 $1,503,943,654
Top Stars at the Worldwide Box Office (Rank 701-800) 708 $3,125,633,658
Highest Grossing Stars of 2019 at the Domestic Box Office (Rank 501-600) 528 31
Highest Grossing Stars of 2020 at the Domestic Box Office (Rank 401-500) 465 31
Highest Grossing Stars of 2021 at the Domestic Box Office (Rank 401-500) 449 31
Highest Grossing Stars of 2019 at the International Box Office (Rank 401-500) 500 12
Highest Grossing Stars of 2020 at the International Box Office (Rank 401-500) 466 12
Highest Grossing Stars of 2021 at the International Box Office (Rank 401-500) 446 12
Highest Grossing Stars of 2019 at the Worldwide Box Office (Rank 501-600) 532 19
Highest Grossing Stars of 2020 at the Worldwide Box Office (Rank 401-500) 497 19
Highest Grossing Stars of 2021 at the Worldwide Box Office (Rank 401-500) 470 19
Top Domestic Leading Stars for Original Screenplay Movies (Rank 1,301-1,400) 1,368 $51,263,177
Top Domestic Leading Stars for Based on Real Life Events Movies (Rank 501-600) 568 $2,039,869
Top International Leading Stars for Original Screenplay Movies (Rank 1,301-1,400) 1,335 $53,567,586
Top International Leading Stars for Based on Real Life Events Movies (Rank 801-900) 844 $232,317
Top Worldwide Leading Stars for Original Screenplay Movies (Rank 1,301-1,400) 1,344 $104,830,763
Top Worldwide Leading Stars for Based on Real Life Events Movies (Rank 701-800) 767 $2,272,186
Top Domestic Leading Stars for Live Action Movies (Rank 1,801-1,900) 1,823 $53,303,046
Top International Leading Stars for Live Action Movies (Rank 1,701-1,800) 1,704 $53,799,903
Top Worldwide Leading Stars for Live Action Movies (Rank 1,701-1,800) 1,748 $107,102,949
Top Domestic Leading Stars for Contemporary Fiction Movies (Rank 1,201-1,300) 1,258 $50,705,936
Top Domestic Leading Stars for Historical Fiction Movies (Rank 1,101-1,200) 1,171 $2,597,110
Top International Leading Stars for Contemporary Fiction Movies (Rank 1,001-1,100) 1,079 $53,518,665
Top International Leading Stars for Historical Fiction Movies (Rank 1,201-1,300) 1,291 $281,238
Top Worldwide Leading Stars for Contemporary Fiction Movies (Rank 1,101-1,200) 1,145 $104,224,601
Top Worldwide Leading Stars for Historical Fiction Movies (Rank 1,401-1,500) 1,461 $2,878,348
Top Domestic Leading Stars for Action Movies (Rank 1,301-1,400) 1,324 $29,262
Top Domestic Leading Stars for Drama Movies (Rank 1,001-1,100) 1,027 $12,217,421
Top Domestic Leading Stars for Thriller/Suspense Movies (Rank 701-800) 774 $2,042,170
Top Domestic Leading Stars for Horror Movies (Rank 301-400) 311 $39,014,193
Top International Leading Stars for Drama Movies (Rank 2,001-2,100) 2,017 $808,441
Top International Leading Stars for Thriller/Suspense Movies (Rank 901-1,000) 997 $285,165
Top International Leading Stars for Horror Movies (Rank 101-200) 198 $52,706,297
Top Worldwide Leading Stars for Action Movies (Rank 1,501-1,600) 1,594 $29,262
Top Worldwide Leading Stars for Drama Movies (Rank 1,401-1,500) 1,472 $13,025,862
Top Worldwide Leading Stars for Thriller/Suspense Movies (Rank 901-1,000) 974 $2,327,335
Top Worldwide Leading Stars for Horror Movies (Rank 201-300) 242 $91,720,490
Top Domestic Leading Stars for R Movies (Rank 801-900) 893 $53,273,784
Top International Leading Stars for R Movies (Rank 701-800) 771 $53,799,903
Top Worldwide Leading Stars for R Movies (Rank 801-900) 818 $107,073,687
Top Domestic Leading Stars for Paramount Pictures Movies (Rank 501-600) 539 $39,014,193
Top International Leading Stars for Paramount Pictures Movies (Rank 301-400) 387 $52,706,297
Top Worldwide Leading Stars for Paramount Pictures Movies (Rank 401-500) 458 $91,720,490

All Technical Credits


Register with The Numbers for free to customize this chart.

Release
Date
TitleRoleDomestic
Box Office
International
Box Office
Worldwide
Box Office
Apr 16, 2021Trigger Point Executive Producer $29,262$29,262
 
Averages $29,262n/a$29,262
Totals 1 $29,262n/a$29,262

Latest Ranking on All Technical Box Office Record Lists


RecordRankAmount
Top Grossing Executive Producer at the Domestic Box Office (Rank 8,901-9,000) 8,950 $29,262
Top Grossing Executive Producer at the Worldwide Box Office (Rank 10,901-11,000) 10,984 $29,262