March 8th, 2016

It's March 8th, which is International Women's Day. This is the one day a year where men flood Twitter asking, "Why isn't there an International Men's Day." ... There is. It's November 19th. ... Anyway, it isn't a great week for new releases. The biggest release is The Peanuts Movie and its 3D Combo Pack is a Pick of the Week contender. However, it just misses out on that title to Unbreakable Kimmy Schmidt: Season 1.
More...
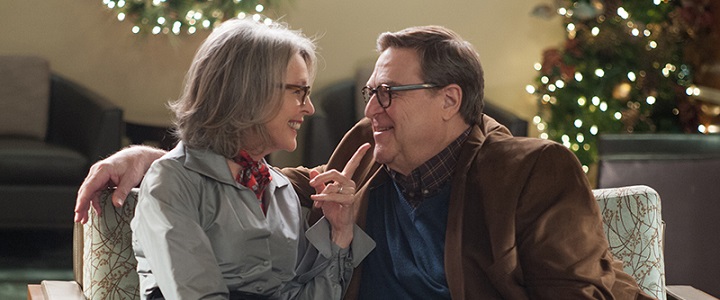
February 8th, 2016

It's a strange week on the home market, as we have a monster release coming out, Spectre. There are also four or so releases that are contenders for Pick of the Week. But after that, there's a huge drop in quality and we quickly reach releases that are not even worthy of being fillers. Of the contenders, Grandma is the Pick of the Week and it is certainly worth picking up on Blu-ray.
More...
December 30th, 2015

Star Wars: The Force Awakens remained on top of the international chart with $133.3 million for a total of $546.0 million after just two weeks of release. Worldwide, the film already has $1.086 billion, putting it in the top 20 all-time after just two weeks of release, although it is still in fifth place for the year. It has been an amazing year on the top. It reached the $1 billion mark in just 12 days, beating Jurassic World's previous record by just one day. Granted, Jurassic World had China to boost its sales. The U.K. remains the film's biggest market with $98.07 million after two weeks of release, including $15.13 million this past weekend. It has also cracked $50 million in Germany ($55.28 million) and is getting close to that milestone in France ($46.14 million). One other note, 2015 became the first year the Walt Disney studio earned $5 billion worldwide in one calendar year. It is still well behind the overall record of $6.8 billion, set by Universal this year.
More...
December 10th, 2015

The Golden Globes nominations were announced this morning and we are already beginning to see a trend for this year's Awards Season. For the most part, the same films are coming up over and over again. Carol led the way with five awards, while there was a three-way tie for second place with The Big Short, The Revenant and Steve Jobs each picking up four.
More...
November 25th, 2015

It appears The Good Dinosaur will win the box office race this weekend with The Hunger Games: Mockingjay, Part 2 being pushed into second place. Creed should have the best opening weekend of the franchise. Meanwhile, Victor Frankenstein is just hoping for a spot in the top five. I don't think it will get there. Both new releases from last year failed to meet expectations, so that gives 2015 a real shot at coming out on top of the year-over-year comparison.
More...
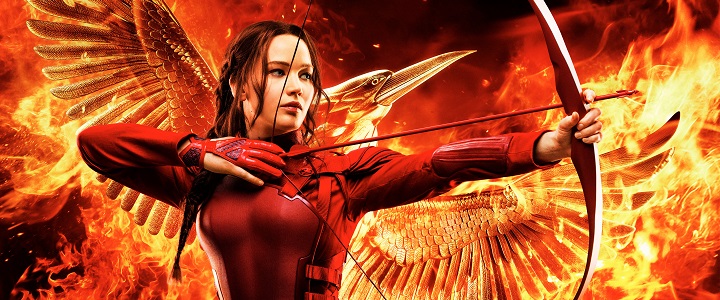
November 24th, 2015
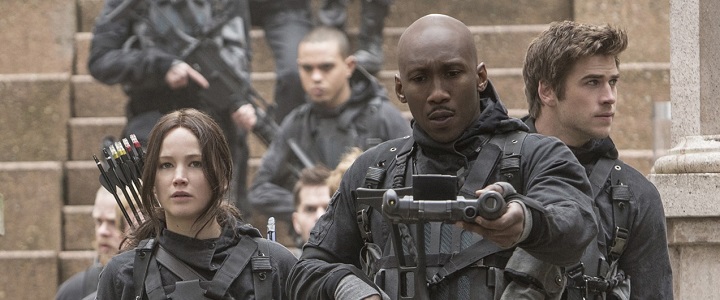
The Curse of the High Expectations strikes again. The Hunger Games: Mockingjay, Part 2 became the fifth film of the year to open with more than $100 million. This should be a reason to celebrate, but it marks a very steep decline from previous films in the Hunger Games franchise. The other two wide releases, The Night Before and Secret in Their Eyes, both failed to meet expectations, leaving the overall box office softer than anticipated. Granted, it still grew 60% from last weekend to $173 million, but this is 10% lower than the same weekend last year. Year-to-date, 2015 is still ahead of 2014 by a comfortable margin of 3.6% or $320 million. It would take a sizable collapse for 2015 to not come out on top in terms of raw box office dollars. On the other hand, it wouldn't take too much for it to slip below ticket price inflation, which is about 2% this year.
More...
November 22nd, 2015

The Hunger Games: Mockingjay—Part 2 is about to record the most disappointing $100 million weekend ever, based on Sunday’s estimate from Lionsgate. Why disappointing? Because its $101.025 million projected opening follows the $158 million earned by Catching Fire on this weekend in 2013 (then the sixth-biggest weekend ever), and the $122 million debut of Mockingjay—Part 1 this weekend last year. That marks a decline of 20% or so from one installment of the franchise to the next, which is the worst performance of any franchise to have recorded a $100 million start. Global numbers tell a similar story: $247 million this weekend against Part 1’s $275 million. However, once we get that troubling statistic out the way, this is also a reason for celebration: $100 million domestically and $250 million globally in one weekend is still a huge amount of money, and caps a spectacularly successful franchise for Lionsgate.
More...
November 20th, 2015
It should be a very busy weekend, at least at the top, as The Hunger Games: Mockingjay, Part 2 is nearly guaranteed to dominate the box office and many think it will top $100 million over the weekend. On the other hand, the other two releases are The Night Before and Secret in Their Eyes, neither of which is expected to do particularly well. That said, they would have to truly bomb to not at least make the top five, but I doubt either of them will top Spectre over the weekend. This weekend last year, The Hunger Games: Mockingjay, Part 1 opened with just over $120 million. That is the figure Part 2 will need to match to be considered a success. I'm feeling cautiously optimistic, but not everyone is.
More...
November 17th, 2015
There's not much in the way of good news to talk about, which is something that is becoming sadly common. Two of the three new releases missed expectations and expectations were low to begin with. Love the Coopers led the new releases, but it is hardly what you would call a box office hit. Even calling it a middling hit is overstating things. The 33 barely managed a spot in the top five and will quickly leave theaters. My All-American missed the Mendoza Line* by a mile and missed the top ten in the process. This meant Spectre and The Peanuts Movie remained on top of the charts, but they could only help the box office avoid becoming a disaster. As it is, the overall box office fell 33% from last weekend to just $108 million. This was 23% less than the same weekend last year. Year-to-date, 2015's lead over 2015 took a real hit and its down to 3.9% at $9.06 billion to $8.72 billion. However, as we've seen recently, the overall box office is weaker than the these numbers look, as we've seen few major hits and many, many bombs.
More...
November 14th, 2015

Three new wide releases are all, as expected, struggling to make much headway against Spectre and The Peanuts Movie this weekend, with the two returning films sitting comfortably at the top of the chart. Spectre picked up an estimated $10.2 million on Friday for a total to date of $105.5 million, while Peanuts earned another $5.6 million, for $63.9 million so far.
More...
November 11th, 2015

Last week the box office bounced back in an impressive fashion. However, this week it will very likely slump back down again. There are only two truly wide releases coming out this week, The 33 and Love the Coopers, neither of which are expected to be hits. In fact, there's a good chance neither of them will top $10 million over the weekend. This will leave Spectre and The Peanuts Movie on top of the charts once again, while we will have a one or two other holdovers in the top five, depending on how well the new wide releases match low expectations. This weekend last year Dumb and Dumber To opened with $36.11 million. This is more than either new release will earn this weekend, or in total. This might be more than both new releases will finish with combined. Unless the holdovers hold on really well, 2015 will lose in the year-over-year comparison, but it should be close.
More...
November 10th, 2015
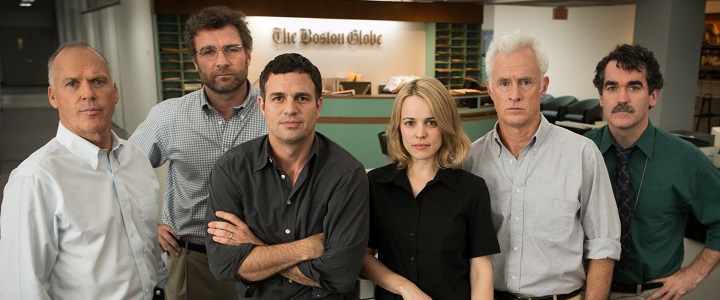
It was a busy week on the per theater chart with seven films in the $10,000 club. Spotlight led the way with an average of $59,002 in five theaters. This is the fourth best opening weekend average of 2015, just ahead of While We're Young and just behind Ex Machina. Brooklyn was next with an average of $37,456, also in five theaters. It opened on Wednesday, so its weekend average was a little lower than it otherwise would have been. The overall number one film, Spectre, was third with an average of $17,919. In Jackson Heights was on the opposite end of the scale playing in just one theater. It did well with an opening of $15,150. Trumbo was very close behind with an average of $14,835 in five theaters. Its reviews suggest it won't expand significantly, but this is a great start. The second wide release of the week was The Peanuts Movie, which opened with an average of $11,345. The final film in the $10,000 club was Peggy Guggenheim - Art Addict, which earned an average of $11,129 in two theaters.
More...
November 9th, 2015

It was a good weekend at the box office, but not a great weekend. Both Spectre and The Peanuts Movie opened well enough to be considered hits, but didn't quite reach the high marks I had expected. Call it irrational exuberance. Even though Spectre didn't break the record for the Bond franchise, it still did almost as well as all of the box office did last weekend. Additionally, The Peanuts Movie opened with more than $40 million, which is a great start, while its target audience should help its legs. The overall box office was $162 million, which is 115% more than last weekend. It was also 3.0% more than the same weekend last week, so the slump we've been in is officially over. Year-to-date, 2015 is now ahead of 2014 by a 4.9% margin at $8.89 billion to $8.48 billion. A $415 million lead with less than two months to go seems really safe, especially with a few more potential monster hits on the way.
More...
November 8th, 2015
After a great night on Thursday and a very good day on Friday, Spectre has faded a bit over the weekend. After posting $28 million on Friday, the film was down about 4% on Saturday to $26.5 million, and Sony is projecting a weekend total of $73 million. Even that number may be a shade high, and it falls well behind the $80 million that looked on the cards earlier in the weekend, and even further behind Skyfall’s franchise-record $88.4 million opening. While by any measure it’s a great debut, the final number does prompt the question: what went wrong over the weekend?
More...
November 7th, 2015

While it doesn’t look as though records will be set, Spectre and Peanuts are both giving the box office a much-needed jolt this weekend. With studio estimates for Friday in, Spectre is the clear winner for the weekend, with $28.1 million for the day, including $5.25 million at preview screenings on Thursday. That compares to Skyfall’s $32.7 million Friday with $2.2 million at previews, and suggests an opening weekend around $78 million for the latest entry in the timeless James Bond franchise.
More...
November 5th, 2015

I've been working at The Numbers for 13 years. The past two weekends were worst back-to-back weekends that I can recall and the numbers back that up. So thank goodness October is over and November has officially begun and with that, the Holiday Box Office season has begun. There are two potential monster hits opening wide this week: Spectre and The Peanuts Movie. Both are the latest installments of long running franchises. Spectre is the 26th Bond movie (not all of which are part of the official Bond franchise). The Peanuts Movie is based on a comic strip that started officially in the 1950s and has been turned into countless TV cartoons and a handful of TV specials over the years, but it hasn't had a theatrical release for decades. These two films should dominate the market and combined they might earn twice as much as all of the films last weekend earned. There should be huge growth compared to last year, when Big Hero 6 and Interstellar earned just over $100 million combined. We've had a really bad couple of weeks, but things should really turn around this weekend.
More...
November 1st, 2015
October has come to an end and everyone should be happy about that. Except for The Martian, there were no serious hits that opened last month. There were more outright bombs than even midlevel hits. Fortunately, October of last year wasn't spectacular either, so 2015 maintains a healthy lead over 2014. Even more fortunately, November looks fantastic. There are four films that have the potential to earn $200 million or more. The biggest of these is the final Hunger Games movie, which should reach $400 million. Spectre has a real shot at $300 million and could be the biggest hit in the franchise. Meanwhile, nearly every November there's an animated kids movie that becomes a monster hit. This year, The Peanuts Movie and The Good Dinosaur are both aiming for that box office milestone. The last time we didn't have a family film that earned at least $100 million in November was 2011 and that's because there were four family films that opened in the final two weeks of the month and that much competition meant they cannibalized each other. Both of these has a shot at $200 million and if neither of them reached $200 million, I would be shocked. Meanwhile, last November was a good month at the top with three monster hits: The Hunger Games: Mockingjay, Part 1, Big Hero 6, and Interstellar. However, after those three films, there were not much positive to talk about. It really looks like 2015 will match 2014 at the top, plus it could have better depth. I might be a little too optimistic, but I think November is going to be a great month at the box office.
More...