March 13th, 2012
Footnote led the way on the per theater chart with an average of $23,764 in two theaters, while Jiro Dreams of Sushi was right behind with an average of $21,018, also in two theaters. Salmon Fishing in the Yemen was playing in a lot more theaters, but it managed an average of $12,550 in 18 theaters. Even more impressively, it saw growth from Friday to Sunday of 85%, which is amazing for a new release. This bodes very well for its long term potential. Finally, the overall box office leader, Dr. Seuss' The Lorax, rounded out the $10,000 club with an average of $10,370.
More...
February 26th, 2012
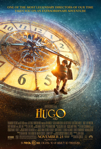
It's Oscars night. (Actually, it's 3:43 in the morning as I'm typing this, but I thought I would get a jump on the celebration.) As I do every year, I will follow the announcements live and update our list of Oscar winners. However, this year I will be doing it a little differently and the list of nominees below will include the favorites as picked by our readers in Italics and as picked by me in Bold. So you can watch live and tell when I'm out of the running for our Oscar contest. (I figure it will take at least 17 wins out of 24 to come out on top. Maybe even 18 or 19 wins.) So, will The Artist be the big winner tonight as our readers predict? Or will Hugo score the upset? Stay tuned to fine out.
More...
February 22nd, 2012
No films topped $10,000 on the per theaters chart; in fact, none of them come close. The Vow came closest with an average of $7,798. Ghost Rider: Spirit of Vengeance was the best new release at an average of $6,968, while the best new limited release was Undefeated at $6,633.
More...
February 19th, 2012
The final major guild, the WGA, handed their awards out tonight. Due to rule differences, they are not as useful when it comes to predicting the Oscars this year as they are in some years, winning is still a good omen. So who won and what does that say about their chances?
More...
February 9th, 2012
With our annual Oscar Prediction contest underway, now is the best time to look at the nominees and try and figure out who the favorites are and which films should just feel honored to be nominated. Today we look at Best Feature-Length Documentary, which is about as competitive as Best Animated Feature Film, for the same reasons. The two films I thought were most likely to win, Bill Cunningham New York and Project Nim, weren't even nominated. There are still favorites and long shots, but there should be a competitive race.
More...
January 31st, 2012
There was only one film to reach the $10,000 mark on the per theater chart this past weekend. An Inconsistant Truth opened with $20,733 in its lone theater, but with still no reviews, its long term chances are still unknown. The phrase, "preaching to the choir" does spring to mind.
More...
January 25th, 2012
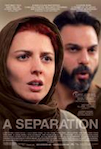
There were only three films this past weekend to reach the $10,000 mark on the per theater average, and none of them were new releases. Pina finally expanded playing in ten theaters, while it climbed to the top of the per theater average with $13,667. It should hit its first major milestone soon. A Separation doubled its theater count and saw its per theater average grow to $12,986. It too should reach its first milestone sooner rather than later. The final member of the $10,000 club was We Need to Talk About Kevin with an average of $10,530 in seven theaters. The best new release of the week was Crazy Horse with $7,963 in its lone theater. However, it was a Wednesday release and if you include its first two days of release, it earned $12,336. If it were a Friday release, it likely would have reached the $10,000 market.
More...
January 24th, 2012
Yesterday was one of the biggest days during Awards Season as The Oscar nominations were announced in the morning. It was a two horse race for top spot as far as the big winners are concerned. Hugo earned the most nominations with eleven, while The Artist was right behind with ten. However, one could argue The Artist is the bigger winner, as more of its nominations were in the more prestigious categories.
More...
January 18th, 2012
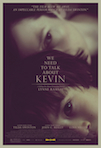
It was a busy week on the per theater chart with five films in the $10,000 club; however, all but one of those films were holdovers. Leading the way was We Need to Talk About Kevin, which returned to theaters after its week-long Oscar qualification run. It earned an average of $21,123 in two theaters. Pina doubled its theater count, but remained strong in second place with an average of $20,740 in six theaters. Even if it doesn't expand significantly, it will reach some major milestones. Despite mixed reviews, Extremely Loud and Incredibly Close is earning very strong legs. This past weekend it dipped just 8% while earning an average of $15,172 in six theaters. It expands wide on Friday and it should do quite well. The only new release of the week to reach the $10,000 club was Sophomore, which opened with an estimated $13,000 in its lone theater. Finally, we get to A Separation, which earned an average of $11,977 in six theaters. Hopefully it will expand to take advantage of is success thus far.
More...
January 10th, 2012
The $10,000 club was again crowded this week and, as expected for this time of year, it was filled almost entirely by holdovers. Iron Lady remained the top film with an average of $35,275 in five theaters and it should start hitting major milestones very soon. Pina's average grew, again, reaching $27,676 in three theaters. Hopefully it will start expanding quickly, before its momentum fades. Extremely Loud and Incredibly Close earned an average of $16,521 in six theaters. Its mixed reviews haven't taken too much of a toll, yet. A Separation doubled its theater count, but its per theater average remained relatively steady at $15,440. The overall box office leader, The Devil Inside, was next at $14,763. Finally, Once Upon a Time in Anatolia opened with $10,652 in one theater.
More...
January 5th, 2012
The latest round of major nominations were released today with the WGA nominations. Like much of the rest of the previous announcements, the only surprise was the lack of surprises. Four of the five Original Screenplays earned other nominations in that category or other guild nominations. That number rises to five out of five for Adapted Screenplays. There's little doubt about what films are Oscar contenders at this point. The Documentary films category is a little more contentious, but it usually is.
More...
January 4th, 2012
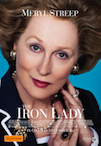
Iron Lady led a group of six films in the $10,000 earning a per theater average of $55,102. This is better than expected and shows the Oscar buzz for Meryl Streep is overcoming the middling overall reviews. Last week's winner, Pina, remained strong with an average of $23,874 in three theaters. I expect it will expand somewhat and earn a small measure of mainstream success. A Separation opened with an average of $19,827 in three theaters and with possible Oscar glory, it continues to do well. Tinker Tailor Soldier Spy has already earned a significant measure of mainstream success and with an average of $19,043 in 55 theaters this past weekend, it had its best weekend yet. It did cost $21 million to make, so it will need to continue to do well for quite some time before it makes profitability likely. Extremely Loud and Incredibly Close's first full weekend went well earning an average of $18,463 in three theaters. It has a shot at expanding wide in a couple weeks, assuming it holds on relatively well over the next couple weeks. The final film in the $10,000 club was Pariah, which earned an average of $12,145 in four theaters. It earned just over $100,000 from Wednesday through Monday.
More...
December 23rd, 2011
There are only seven films on this week's list of limited releases; however, five of them were earning at least some measure of Awards Season buzz. This is hardly unusual for this time of year. What is unusual is that almost none of them are earning overall positive reviews. The one exception is Pina, which has 93% positive reviews, but as a documentary / concert film, it might struggle to find an audience outside of fans of modern dance. On the other hand, while Albert Nobbs' overall reviews are merely mixed, it has a chance to find a sizable audience, thanks in part to its numerous early nominations.
More...