September 4th, 2013
It was a very lop-sided week on the per theater chart with a couple of films in the $10,000 club, but the rest of the new limited releases, and a couple of new wide releases, were floating around, or below, the Mendoza Line. Instructions Not Included was the best with an average of $22,547 in 348 theaters. Stunning. This result is simply stunning. Afternoon Delight was next with an average of $13,676 in two theaters. Neither film earned good reviews, so it will be interesting to see if either can capitalize on this start.
More...
August 21st, 2013
Space Station remained in first place on the per theater chart, again with $30,602. The film has made $2 million so far this year and it seems likely it will last long enough to get to $100 million in total, eventually.
You Will Be My Son was next with $15,301 in one theater. Surprisingly
Austenland made the $10,000 club. Given its
reviews and its
genre, earning its per theater average of $10,166 in four theaters is surprisingly high.
Blue Jasmine rounded out the $10,000 club with $10,005. It is already playing in 229 theaters and it will expand more.
More...
August 15th, 2013
IMAX movies have incredible legs and can bounce back in the $10,000 club years and years after their first release. Space Station jumped into first place with an average of $30,602 in one theater. In a World was the best new release with an average of $23,514 in three theaters. It is going to expand and we will have a contest starting on Friday to celebrate. Snake and Mongoose was close behind with $20,254 in its lone theater. Blue Jasmine continues to expand and it is now playing in 119 theaters. However, its average remains very strong at $19,709 and it will undoubtedly continue to expand. The Spectacular Now expanded from 4 to 19 theaters, while its average fell to $14,045. This is still strong enough to suggest further expansion and it should reach its first major milestone shortly. Chennai Express broke records for a Bollywood film playing in 196 theaters, while its per theater average was $11,329. That's an incredible start.
More...
August 13th, 2013
There were four films that opened wide last week and while none of them were monster hits, three of the four of them were solid openings. Elysium opened in first place, but landed on the lower end of expectations. We're the Millers was a bit of a surprise hit, earning more over five days than it cost to make. Disney's Planes had the best opening for an animated film in August. There's not a lot of competition for that record. Finally there was Percy Jackson: Sea of Monsters, which will cost the studio a fortune. With four new releases taking the top four spots, it should be no surprise that the overall box office was strong. In fact, it rose 16% from last weekend to $159 million. No film was able to match last year's winner, The Bourne Legacy, but we had a lot better depth this time around. This helped 2013 win the year-over-year comparison by 12%. Meanwhile, 2013 has completed the comeback and now has a 3.6% lead over 2012 at $6.85 billion to $6.61 billion.
More...
August 11th, 2013
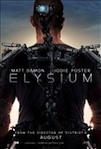
The waning days of the Summer season are seeing a glut of films as distributors try to find one last hit. Four films opened in wide release this weekend and, even though they played to quite different demographics, they will ultimately all fall somewhat short of expectations (or, more accurately, hopes). Topping the pack will be Elysium, which is expected to earn $30.5 million by Sunday evening -- a solid enough performance, but not enough to make a serious dent in its $120 million production budget. Good legs and an impressive international run will be needed for this one to turn a profit. We're the Millers will land in second place for the weekend with about $26.5 million, but will arguably have had a better start, with $38 million earned in total since it opened on Wednesday (not to mention a much lower production cost). Planes will be third with $22.5 million or so, which is OK for a film that was originally destined for a direct-to-video release. The real bomb of the weekend is Percy Jackson: Sea of Monsters, with $14.6 million expected Friday to Sunday and $23.5 million in total over five days.
More...
August 9th, 2013
It is not a good week for limited releases with a couple of higher profile releases failing to win over critics. Lovelace had been earning a lot of buzz before its release, but the reviews suggest it won't be able to capitalize on this buzz. On the other hand, In a World is earning surprisingly strong reviews and it does have a lot of name recognition in the cast, so hopefully it will thrive.
More...