August 2nd, 2017
-1-News.jpg)
There is no monster hit coming out this week, but that doesn’t mean there are no new DVD / Blu-rays worth picking up. In fact, there are six Pick of the Week contenders. This includes Slither: Collector's Edition, which took home the title in a close race. There are also two co-winners of the Puck of the Week for best Canadian release, Colossal on Blu-ray Combo Pack and I am the Blues on DVD.
More...
July 11th, 2017
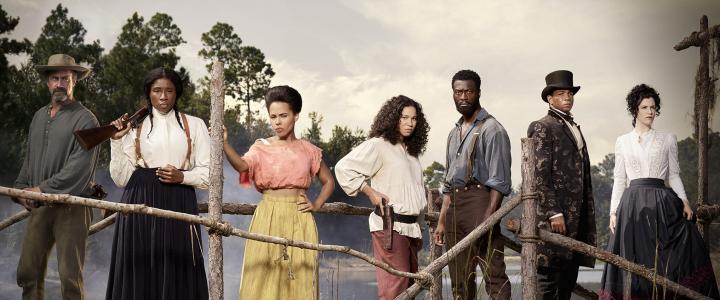
This week, the home market is led by The Fate of the Furious, which is the number one film both in terms of worldwide box office and alphabetically. It earned well over $1 billion worldwide, but it is losing the charm the franchise thrived on during the past few installments. As for the Pick of the Week, I’m going with Underground, Season Two, or the Two-Season box set.
More...
April 27th, 2017
-2-News.jpg)
The last weekend in April is usually a terrible weekend and this year is no different. There is only one truly wide release this week, The Circle, although How to be a Latin Lover has a shot at the top five. There are also two films opening in approximately 500 theaters hoping to sneak into the top ten: Sleight and Baahubali 2: The Conclusion. However, while it seems like a busy week for new releases, The Fate of the Furious will easily remain in first place. In fact, the top five this week could be nearly identical to the top five last week, with The Circle being the only nearly guaranteed new addition. This weekend last year, The Jungle Book led the way with $44 million, while the biggest new release was Keanu with just under $10 million. The new releases might be stronger this time around, but there’s almost no way 2017 will be able to compete with The Jungle Book.
More...
April 25th, 2017

As expected, The Fate of the Furious dominated the weekend box office chart. It held up a little better than expected with $38.41 million over the weekend; however, this was still over 60% lower than its opening weekend and the overall weekend fell over $60 million or 36% from last weekend for a total of $107 million. A lot of the blame can be pushed onto the new releases, as none of them earned a spot in the top five. Born in China was the best of the new releases earning sixth place with $4.79 million. Year-over-year, 2017 was 16% lower than 2016, but fortunately, 2017 still has an impressive $200 million lead over 2016 at $3.53 billion to $3.33 billion.
More...
April 22nd, 2017

The Fate of the Furious dominated the box office chart on Friday with $11.2 million. This could be more than any other film will earn during the entire weekend. That’s the good news. The bad news is this still represents a decline of just over 75% from its opening Friday. This is not good by any stretch of the word, but it is also not unexpected. The film will rebound on Saturday, and earn about $35.5 million over the weekend, according to Universal, which is close to our prediction and will lift the film’s running tally to $160 million. This keeps The Fate of the Furious on pace for $200 million and the film should become the third film released in 2017 to get to that milestone. It might overtake Logan on the yearly chart, but Guardians of the Galaxy, Vol. 2 will probably get there first.
More...
April 9th, 2017

The Boss Baby will score another win at the box office this weekend, with Fox predicting a total of $26.3 million for the weekend, down 48% from its debut, and $89.4 million to date. That’s a remarkably strong second weekend, considering that Beauty and the Beast will be down virtually the same proporation—45%—in its fourth weekend. Disney’s blockbuster will do $25 million for a cume of $432 million so far domestically. With $545.1 million internationally, the film now has $977.4 million worldwide, and will pass the billion dollar mark this week.
More...
April 6th, 2017

It is the first weekend of April and there are two and a half films opening wide this week. The widest of these is Smurfs: The Lost Village, but direct competition is going to hurt it at the box office. Going in Style is aiming to be a sleeper hit, but its reviews will likely get in the way of that. Meanwhile, The Case for Christ is opening in barely more than 1,000 theaters and it is aiming for the churchgoing crowd and no one else. On the positive side, it is Easter next weekend, so it should have good legs. Unfortunately for the new releases, it looks like The Boss Baby will have a relatively easy time repeating in first place, while Beauty and the Beast will be close behind in second. This weekend last year, The Boss opened in first place with $23.59 million, while Batman v Superman: Dawn of Justice was right behind with $23.36 million. This week we should have at least two films top that, perhaps even three if Smurfs: The Lost Village is on the high end of expectations. 2017 should continue to add to its lead over 2016.
More...
April 1st, 2017

March was a month of extremes, led by two strong performances: Beauty and the Beast breaking records and Logan cracking $200 million with ease. There were also two other $100 million hits and another potential $100 million hit that we don’t have significant box office numbers for yet. This is fantastic. On the opposite end, there were three films on last month’s list that didn’t even open truly wide. This month won’t be as lucrative at the top, as The Fate of the Furious is the only film expected to top $100 million. Fortunately, it is expected to open with over $100 million. On the other extreme, there are many, many films on this list that I’m not sure will open wide. Fortunately, last April wasn’t any better. The Jungle Book made nearly $1 billion worldwide, but the other nine films combined made less than half of that. To emphasize: the other nine films that opened last April averaged less than $50 million worldwide each. If The Fate of the Furious can just come close to the previous installment of the franchise, then 2017 has a solid shot at topping 2016.
More...
March 31st, 2017

There are three wide releases opening next weekend, but only Smurfs: The Lost Village has a shot at topping the chart. Going in Style would be happy with a total of $50 million domestically, while The Case for Christ might not even open truly wide. Because of this, Smurfs: The Lost Village is the best choice for the target film in this week’s box office prediction contest. In order to win, one must simply predict the opening weekend box office number for Smurfs: The Lost Village.
April 1st is on Saturday, so we are starting our April Fools contests this week. Two of our winners will get movies from our prize pool, while one will be chosen at random to be the fool and receive an HD-DVD release.
Whoever comes the closest to predicting the film's opening 3-day weekend box office (Friday to Sunday), without going over, will win one of two previously reviewed movies, or be the winner of the Fool’s Prize.
Whoever comes the closest to predicting the film's opening 3-day weekend box office (Friday to Sunday), without going under, will also be a potential winner of two previously reviewed movies, or the winner of the Fool’s Prize.
Finally, we will be choosing an entrant from the group of people who haven't won, or haven't won recently, and they will win either the final of two previously reviewed movies, or be the winner of the Fool’s Prize.
Entries must be received by 10 a.m., Pacific Time on Friday to be eligible, so don't delay!
More...
February 16th, 2017
Heist comedy starring Morgan Freeman, Michael Caine, and Alan Arkin opens April 7, 2017 ... Full Movie Details.
More...
.jpg)