Eddie Murphy

Eddie Murphy
By David Shankbone (flickr) [CC BY 2.0], via Wikimedia Commons
Best known as a Leading Actor based on credits in that role in 43 films, with $6,600,401,430 worldwide aggregate box office (rank #8)
Best-known acting roles: Donkey (Shrek 2), Donkey (Shrek the Third), Donkey (Shrek Forever After), The Donkey (Shrek), James 'Thunder' Early (Dreamgirls)
Best-known technical roles: Norbit (Screenwriter), Norbit (Story Creator), Tower Heist (Producer), Coming to America (Story Creator), Harlem Nights (Director)
Most productive collaborators: Mike Myers, Andrew Adamson, Cameron Diaz, Aron Warner, Brian Robbins
Born: April 3, 1961 (62 years old)
                                    

  1. Summary
  2. News
  3. Acting Credits
  4. Technical Credits

Career Summary


  MoviesDomestic
Box Office
International
Box Office
Worldwide
Box Office
As an ActorLeading43$3,505,591,059$3,094,810,371$6,600,401,430
Supporting2$223,986,210$235,134,140$459,120,350
Lead Ensemble Member2$78,046,570$72,376,376$150,422,946
(Unclassified)1$0$0$0
In Technical RolesProducer6$97,683,717$72,376,376$170,060,093
Story Creator3$243,463,055$223,947,699$467,410,754
Screenwriter2$156,530,869$98,300,000$254,830,869
Director1$60,857,262$35,000,000$95,857,262
Character Creator1$0$0$0

Career Trend

This graph shows Eddie Murphy’s score on our annual analysis of leading stars at the box office. The Star Score represents points assigned to each of the leading stars of the top 100 movies (based on box office) in the current year and two preceding years. For appearing in the number one movie in a year a star gets 100 points, the number two movie 99 points and so on..

Latest Ranking on Selected Box Office Record Lists


RecordRankAmount
Top 100 Stars in Leading Roles at the Domestic Box Office 15 $3,583,637,629
Top Above the Line Stars at the Domestic Box Office 67 $2,799,061,688
Top Stars at the Domestic Box Office 61 $3,807,623,839
Top 100 Stars in Leading Roles at the International Box Office 63 $3,167,186,747
Top Stars at the International Box Office (Rank 201-300) 265 $3,402,320,887
Top 100 Stars in Leading Roles at the Worldwide Box Office 39 $6,750,824,376
Top Stars at the Worldwide Box Office (Rank 101-200) 155 $7,209,944,726
Top Grossing Director at the Domestic Box Office (Rank 901-1,000) 972 $60,857,262
Top Grossing Producer at the Domestic Box Office (Rank 1,101-1,200) 1,167 $97,683,717
Top Grossing Screenwriter at the Domestic Box Office (Rank 801-900) 807 $156,530,869
Top Grossing Story Creator at the Domestic Box Office (Rank 201-300) 218 $243,463,055
Top Grossing Director at the International Box Office (Rank 1,401-1,500) 1,409 $35,000,000
Top Grossing Producer at the International Box Office (Rank 1,501-1,600) 1,530 $72,376,376
Top Grossing Screenwriter at the International Box Office (Rank 1,201-1,300) 1,248 $98,300,000
Top Grossing Story Creator at the International Box Office (Rank 301-400) 397 $223,947,699
Top Grossing Director at the Worldwide Box Office (Rank 1,101-1,200) 1,158 $95,857,262
Top Grossing Producer at the Worldwide Box Office (Rank 1,301-1,400) 1,342 $170,060,093
Top Grossing Screenwriter at the Worldwide Box Office (Rank 1,001-1,100) 1,008 $254,830,869
Top Grossing Story Creator at the Worldwide Box Office (Rank 301-400) 305 $467,410,754

See the Acting Credits tab for all Acting Box Office Records and the Technical Credits tab for all Technical Box Office Records.


Coming 2 America trailer

December 22nd, 2020

Comedy starring Eddie Murphy and Arsenio Hall comes to Amazon Prime on March 5 ... Full Movie Details.

From the lush and royal country of Zamunda, newly-crowned King Akeem and his trusted confidante Semmi embark on an all-new adventure that has them traversing the globe from their great African nation to the borough of Queens, New York—where it all began. More...

2020 Awards Season: Golden Globes Nominations

December 11th, 2019

Marriage Story

The Golden Globes nominations are the second major Awards Season set to come out. It is still very early in the year and the predictive value of the Golden Globes is a little suspect, but there are still some things to learn here. (This is especially true on the TV end, as there’s talk about how strange the nominations are this year.) Marriage Story led the way with six nominations, just ahead of The Irishman and Once Upon a Time... in Hollywood, both of which picked up five nods. More...

Home Market Releases for June 12th, 2018

June 12th, 2018

Love, Simon

There are not many big releases on this week’s list. Tomb Raider, Sherlock Gnomes, The Strangers: Prey at Night, and Love, Simon were, at best, midlevel hits domestically. Worse still, only the last one earned good reviews. Fortunately, the film is good enough that the DVD, Blu-ray Combo Pack, or 4K Ultra HD Combo Pack is worthy as Pick of the Week. More...

Home Market Releases for October 25th, 2016

October 24th, 2016

Finding Dory

It’s not a great week on the home market, as the biggest release of the week is the low-budget horror film, Lights Out. It is worth picking up on Blu-ray, but it is not worth the Pick of the Week title. The best film on this week’s list is Finding Dory, but it is only coming out on Video on Demand and it is worth waiting for the Blu-ray. That said, there’s no top-notch competition, so it is the Pick of the Week. More...

Theater Averages: Yerevan Highlight of Dark Weekend with an Average of $9,748

September 21st, 2016

3 Weeks in Yerevan

No films made it into the $10,000 club this past weekend, but 3 Weeks in Yerevan came really close with an average of $9,748 in three theaters. Another film, The Beatles: Eight Days a Week, did well with an average of $7,322 in 85 theaters. Sort of. In addition to playing in 85 theaters, there were another 80 theaters that had one-time showings over the weekend, which is why its total haul for the weekend is $771,153. I really hope having a mixed of regular showings and one-time screenings doesn’t catch on, because it makes our job of tracking box office numbers more confusing. More...

Weekend Estimates: Sully Beats Trio of New Releases

September 18th, 2016

Sully

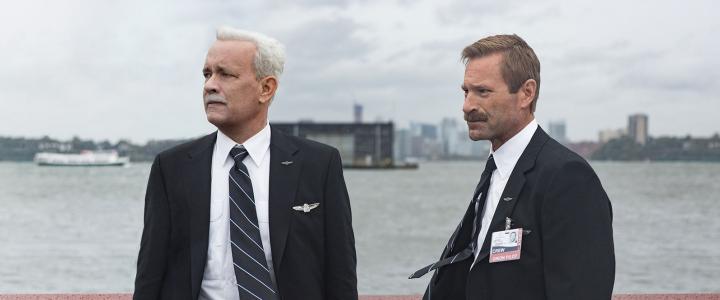
As expected, this weekend’s three new wide releases couldn’t budge Sully from the top of the chart with the Tom Hanks/Clint Eastwood drama down a very respectable 37% in its second weekend to $22 million, for a total of $70.5 million to date. Two films, Blair Witch and Bridget Jones’s Baby both had aspirations to challenge Sully for the title, but had to settle for second and third place. More...

Limited and VOD Releases: Waiting All Week for Limited Releases

September 16th, 2016

The Beatles: Eight Days a Week, The Working Years

There are almost 30 films opening in limited release this week, so obviously I won’t have time talk about all of them. I won’t have time to talk about half of them. The two films that stand out in this crowd are The Beatles: Eight Days a Week, The Working Years and Miss Stevens. Both are earning great reviews, but the former is a documentary and the latter debuts on VOD on Tuesday, so neither has a great shot at box office success. More...

All Acting Credits

Announced (Undated)

The Pickup

Register with The Numbers for free to customize this chart.

Release
Date
TitleRoleDomestic
Box Office
International
Box Office
Worldwide
Box Office
Jul 3, 2024Beverly Hills Cop: Axe… Axel Foley
Dec 1, 2023Candy Cane Lane Chris
Jan 27, 2023You People
Mar 5, 2021Coming 2 America Akeem
Oct 11, 2019Dolemite is My Name Rudy Ray Moore
Sep 16, 2016Mr. Church Henry Church $685,780$685,780
Mar 9, 2012A Thousand Words Jack McCall $18,450,127$2,340,359$20,790,486
Nov 4, 2011Tower Heist Slide $78,046,570$72,376,376$150,422,946
May 21, 2010Shrek Forever After Donkey $238,736,787$517,507,886$756,244,673
Jun 12, 2009Imagine That Evan Danielson $16,222,392$6,215,752$22,438,144
Jul 11, 2008Meet Dave Dave $11,803,254$38,845,552$50,648,806
May 17, 2007Shrek the Third Donkey $322,719,944$484,610,992$807,330,936
Feb 9, 2007Norbit Norbit/Rasputia/M… $95,673,607$63,300,000$158,973,607
Feb 6, 2007Eddie Murphy Delirious Himself
Dec 15, 2006Dreamgirls James 'Thunder' E… $103,365,956$52,254,394$155,620,350
May 19, 2004Shrek 2 Donkey $441,426,807$494,027,731$935,454,538
Nov 26, 2003The Haunted Mansion Jim Evers $75,817,994$79,932,634$155,750,628
May 9, 2003Daddy Day Care Charlie Hinton $104,148,781$60,136,806$164,285,587
Nov 1, 2002I Spy Kelly Robinson $33,561,137$26,718,685$60,279,822
Aug 16, 2002The Adventures of Plut… Pluto Nash $4,411,102$2,683,893$7,094,995
Mar 15, 2002Showtime Trey $37,948,765$41,000,000$78,948,765
Jun 22, 2001Dr. Dolittle 2 Dr. John Dolittle $112,950,721$63,151,000$176,101,721
May 18, 2001Shrek The Donkey $268,028,651$224,157,783$492,186,434
Jul 28, 2000Nutty Professor II: Th… Sherman Klump/Bud… $123,307,945$43,000,000$166,307,945
Aug 13, 1999Bowfinger Kit Ramsey/Jiff R… $66,458,769$32,241,000$98,699,769
Apr 16, 1999Life Ray $64,062,587$9,459,000$73,521,587
Oct 9, 1998Holy Man G $12,069,719$12,069,719
Jun 26, 1998Doctor Dolittle Dr. John Dolittle $144,156,605$150,000,000$294,156,605
Jun 19, 1998Mulan Mushu (voice) $120,620,254$182,879,746$303,500,000
Jan 17, 1997Metro Scott Roper $32,017,895$32,017,895
Jun 28, 1996The Nutty Professor Sherman Klump/Bud… $128,814,019$145,000,000$273,814,019
Oct 27, 1995Vampire in Brooklyn Maximillian/Preac… $19,637,147$19,637,147
May 25, 1994Beverly Hills Cop III Axel Foley $42,586,861$76,594,077$119,180,938
Dec 4, 1992The Distinguished Gent… Thomas Jefferson … $46,434,570$46,434,570
Jul 1, 1992Boomerang Marcus $70,052,444$61,000,000$131,052,444
Jun 8, 1990Another 48 Hrs. Reggie Hammond $80,047,413$72,700,000$152,747,413
Nov 17, 1989Harlem Nights Quick $60,857,262$35,000,000$95,857,262
Jun 29, 1988Coming to America Clarence/Prince A… $128,152,301$160,647,699$288,800,000
Dec 18, 1987Eddie Murphy Raw Himself $50,504,655$50,504,655
May 20, 1987Beverly Hills Cop II Axel Foley $153,665,036$123,000,000$276,665,036
Dec 12, 1986The Golden Child Chandler Jarrell $79,817,937$79,817,937
Dec 5, 1984Beverly Hills Cop Axel Foley $234,760,478$81,539,522$316,300,000
Jul 20, 1984Best Defense Lieutenant T.M. L… $19,265,302$19,265,302
Jun 8, 1983Trading Places Billy Ray Valentine $90,400,000$90,400,000
Dec 8, 198248 Hrs. Reggie Hammond $75,936,265$75,936,265
 
Averages $97,631,380$117,321,410$184,870,378
Totals 45 $3,807,623,839$3,402,320,887$7,209,944,726


Leading or Lead Ensemble Roles


Register with The Numbers for free to customize this chart.

Release
Date
TitleOpening
Weekend
Maximum
Theaters
Domestic
Box Office
Worldwide
Box Office
Domestic
Share
Jul 3, 2024Beverly Hills Cop: Axe…
Dec 1, 2023Candy Cane Lane
Jan 27, 2023You People
Mar 5, 2021Coming 2 America
Oct 11, 2019Dolemite is My Name
Sep 16, 2016Mr. Church $338,551354$685,780$685,780100.0%
Mar 9, 2012A Thousand Words $6,176,2801,895$18,450,127$20,790,48688.7%
Nov 4, 2011Tower Heist $24,025,1903,370$78,046,570$150,422,94651.9%
May 21, 2010Shrek Forever After $70,838,2074,386$238,736,787$756,244,67331.6%
Jun 12, 2009Imagine That $5,503,5193,011$16,222,392$22,438,14472.3%
Jul 11, 2008Meet Dave $5,251,9183,011$11,803,254$50,648,80623.3%
May 17, 2007Shrek the Third $121,629,2704,172$322,719,944$807,330,93640.0%
Feb 9, 2007Norbit $34,195,4343,145$95,673,607$158,973,60760.2%
Feb 6, 2007Eddie Murphy Delirious
May 19, 2004Shrek 2 $108,037,8784,223$441,426,807$935,454,53847.2%
Nov 26, 2003The Haunted Mansion $24,278,4103,122$75,817,994$155,750,62848.7%
May 9, 2003Daddy Day Care $27,623,5803,472$104,148,781$164,285,58763.4%
Nov 1, 2002I Spy $12,752,8033,182$33,561,137$60,279,82255.7%
Aug 16, 2002The Adventures of Plut… $2,182,9002,320$4,411,102$7,094,99562.2%
Mar 15, 2002Showtime $15,011,4302,917$37,948,765$78,948,76548.1%
Jun 22, 2001Dr. Dolittle 2 $25,037,0393,067$112,950,721$176,101,72164.1%
May 18, 2001Shrek $42,347,7603,715$268,028,651$492,186,43454.5%
Jul 28, 2000Nutty Professor II: Th… $42,518,8303,251$123,307,945$166,307,94574.1%
Aug 13, 1999Bowfinger $18,062,5502,732$66,458,769$98,699,76967.3%
Apr 16, 1999Life $20,414,7752,615$64,062,587$73,521,58787.1%
Oct 9, 1998Holy Man $5,106,9192,013$12,069,719$12,069,719100.0%
Jun 26, 1998Doctor Dolittle $29,014,3242,874$144,156,605$294,156,60549.0%
Jan 17, 1997Metro $11,411,1072,005$32,017,895$32,017,895100.0%
Jun 28, 1996The Nutty Professor $25,411,7252,239$128,814,019$273,814,01947.0%
Oct 27, 1995Vampire in Brooklyn $7,045,3792,307$19,637,147$19,637,147100.0%
May 25, 1994Beverly Hills Cop III $15,276,2242,748$42,586,861$119,180,93835.7%
Dec 4, 1992The Distinguished Gent… $10,611,0401,984$46,434,570$46,434,570100.0%
Jul 1, 1992Boomerang $13,640,7062,145$70,052,444$131,052,44453.5%
Jun 8, 1990Another 48 Hrs. $19,470,5962,301$80,047,413$152,747,41352.4%
Nov 17, 1989Harlem Nights $16,096,8082,180$60,857,262$95,857,26263.5%
Jun 29, 1988Coming to America $21,404,4202,064$128,152,301$288,800,00044.4%
Dec 18, 1987Eddie Murphy Raw $9,077,3241,494$50,504,655$50,504,655100.0%
May 20, 1987Beverly Hills Cop II $26,348,5552,326$153,665,036$276,665,03655.5%
Dec 12, 1986The Golden Child $11,549,7111,714$79,817,937$79,817,937100.0%
Dec 5, 1984Beverly Hills Cop $15,214,8052,006$234,760,478$316,300,00074.2%
Jul 20, 1984Best Defense $7,872,2971,425$19,265,302$19,265,302100.0%
Jun 8, 1983Trading Places $7,348,2001,387$90,400,000$90,400,000100.0%
Dec 8, 198248 Hrs. $4,369,8681,050$75,936,265$75,936,265100.0%
 
Averages $23,310,7122,547$96,855,071$182,454,71368.0%
Totals 43 $3,583,637,629$6,750,824,376


Supporting Roles


Register with The Numbers for free to customize this chart.

Release
Date
TitleOpening
Weekend
Maximum
Theaters
Domestic
Box Office
Worldwide
Box Office
Domestic
Share
Dec 15, 2006Dreamgirls $378,9502,797$103,365,956$155,620,35066.4%
Jun 19, 1998Mulan $22,745,1432,953$120,620,254$303,500,00039.7%
 
Averages $11,562,0472,875$111,993,105$229,560,17553.1%
Totals 2 $223,986,210$459,120,350

Latest Ranking on All Acting Box Office Record Lists


RecordRankAmount
Top 100 Stars in Leading Roles at the Domestic Box Office 15 $3,583,637,629
Top 100 Stars in Supporting Roles at the Domestic Box Office (Rank 7,201-7,300) 7,246 $223,986,210
Top Live Action Stars at the Domestic Box Office (Rank 101-200) 147 $2,416,091,396
Top Above the Line Stars at the Domestic Box Office 67 $2,799,061,688
Top Stars at the Domestic Box Office 61 $3,807,623,839
Top 100 Stars in Leading Roles at the International Box Office 63 $3,167,186,747
Top 100 Stars in Supporting Roles at the International Box Office (Rank 9,601-9,700) 9,646 $235,134,140
Top Live Action Stars at the International Box Office (Rank 701-800) 742 $1,499,136,749
Top Above the Line Stars at the International Box Office (Rank 101-200) 183 $2,696,895,468
Top Stars at the International Box Office (Rank 201-300) 265 $3,402,320,887
Top 100 Stars in Leading Roles at the Worldwide Box Office 39 $6,750,824,376
Top 100 Stars in Supporting Roles at the Worldwide Box Office (Rank 8,401-8,500) 8,432 $459,120,350
Top Live Action Stars at the Worldwide Box Office (Rank 301-400) 353 $3,915,228,145
Top Above the Line Stars at the Wordwide Box Office (Rank 101-200) 133 $5,495,957,156
Top Stars at the Worldwide Box Office (Rank 101-200) 155 $7,209,944,726
Highest Grossing Stars of 1982 at the Domestic Box Office 44 94
Highest Grossing Stars of 1983 at the Domestic Box Office 12 191
Highest Grossing Stars of 1984 at the Domestic Box Office 2 337
Highest Grossing Stars of 1985 at the Domestic Box Office 11 243
Highest Grossing Stars of 1986 at the Domestic Box Office 12 239
Highest Grossing Stars of 1987 at the Domestic Box Office 10 272
Highest Grossing Stars of 1988 at the Domestic Box Office 7 370
Highest Grossing Stars of 1989 at the Domestic Box Office 2 357
Highest Grossing Stars of 1990 at the Domestic Box Office 12 265
Highest Grossing Stars of 1991 at the Domestic Box Office 35 167
Highest Grossing Stars of 1992 at the Domestic Box Office 19 237
Highest Grossing Stars of 1993 at the Domestic Box Office 50 150
Highest Grossing Stars of 1994 at the Domestic Box Office 23 217
Highest Grossing Stars of 1995 at the Domestic Box Office 87 85
Highest Grossing Stars of 1996 at the Domestic Box Office 37 178
Highest Grossing Stars of 1997 at the Domestic Box Office 46 150
Highest Grossing Stars of 1998 at the Domestic Box Office 21 227
Highest Grossing Stars of 1999 at the Domestic Box Office 14 264
Highest Grossing Stars of 2000 at the Domestic Box Office 6 310
Highest Grossing Stars of 2001 at the Domestic Box Office 4 300
Highest Grossing Stars of 2002 at the Domestic Box Office 17 225
Highest Grossing Stars of 2003 at the Domestic Box Office 6 278
Highest Grossing Stars of 2004 at the Domestic Box Office 28 193
Highest Grossing Stars of 2005 at the Domestic Box Office 59 138
Highest Grossing Stars of 2007 at the Domestic Box Office (Rank 101-200) 156 71
Highest Grossing Stars of 2008 at the Domestic Box Office (Rank 101-200) 159 71
Highest Grossing Stars of 2009 at the Domestic Box Office (Rank 101-200) 191 71
Highest Grossing Stars of 2011 at the Domestic Box Office (Rank 201-300) 280 59
Highest Grossing Stars of 2012 at the Domestic Box Office (Rank 201-300) 275 59
Highest Grossing Stars of 2013 at the Domestic Box Office (Rank 201-300) 282 59
Highest Grossing Stars of 2000 at the International Box Office 20 209
Highest Grossing Stars of 2001 at the International Box Office 23 190
Highest Grossing Stars of 2002 at the International Box Office 19 220
Highest Grossing Stars of 2003 at the International Box Office 5 295
Highest Grossing Stars of 2004 at the International Box Office 18 224
Highest Grossing Stars of 2005 at the International Box Office 56 135
Highest Grossing Stars of 2007 at the International Box Office (Rank 101-200) 180 51
Highest Grossing Stars of 2008 at the International Box Office (Rank 101-200) 161 70
Highest Grossing Stars of 2009 at the International Box Office (Rank 101-200) 188 70
Highest Grossing Stars of 2010 at the International Box Office (Rank 301-400) 360 19
Highest Grossing Stars of 2011 at the International Box Office (Rank 301-400) 321 42
Highest Grossing Stars of 2012 at the International Box Office (Rank 301-400) 338 42
Highest Grossing Stars of 2013 at the International Box Office (Rank 301-400) 361 42
Highest Grossing Stars of 2000 at the Worldwide Box Office 11 286
Highest Grossing Stars of 2001 at the Worldwide Box Office 11 269
Highest Grossing Stars of 2002 at the Worldwide Box Office 16 228
Highest Grossing Stars of 2003 at the Worldwide Box Office 5 287
Highest Grossing Stars of 2004 at the Worldwide Box Office 24 211
Highest Grossing Stars of 2005 at the Worldwide Box Office 63 135
Highest Grossing Stars of 2007 at the Worldwide Box Office (Rank 101-200) 160 67
Highest Grossing Stars of 2008 at the Worldwide Box Office (Rank 101-200) 163 70
Highest Grossing Stars of 2009 at the Worldwide Box Office (Rank 101-200) 198 70
Highest Grossing Stars of 2010 at the Worldwide Box Office (Rank 401-500) 427 3
Highest Grossing Stars of 2011 at the Worldwide Box Office (Rank 201-300) 294 51
Highest Grossing Stars of 2012 at the Worldwide Box Office (Rank 301-400) 309 51
Highest Grossing Stars of 2013 at the Worldwide Box Office (Rank 301-400) 318 51
Top Domestic Leading Stars for Original Screenplay Movies 24 $1,674,851,717
Top Domestic Leading Stars for Based on Fiction Book/Short Story Movies 5 $1,547,284,817
Top Domestic Leading Stars for Based on TV Movies (Rank 301-400) 317 $33,561,137
Top Domestic Leading Stars for Remake Movies 41 $252,121,964
Top Domestic Leading Stars for Based on Theme Park Ride Movies 16 $75,817,994
Top International Leading Stars for Original Screenplay Movies (Rank 101-200) 107 $939,080,036
Top International Leading Stars for Based on Fiction Book/Short Story Movies 11 $1,933,455,392
Top International Leading Stars for Based on TV Movies (Rank 201-300) 283 $26,718,685
Top International Leading Stars for Remake Movies 68 $188,000,000
Top International Leading Stars for Based on Theme Park Ride Movies 16 $79,932,634
Top Worldwide Leading Stars for Original Screenplay Movies 50 $2,613,931,753
Top Worldwide Leading Stars for Based on Fiction Book/Short Story Movies 7 $3,480,740,209
Top Worldwide Leading Stars for Based on TV Movies (Rank 201-300) 297 $60,279,822
Top Worldwide Leading Stars for Remake Movies 53 $440,121,964
Top Worldwide Leading Stars for Based on Theme Park Ride Movies 16 $155,750,628
Top Domestic Leading Stars for Live Action Movies 19 $2,312,725,440
Top Domestic Leading Stars for Digital Animation Movies 4 $1,270,912,189
Top International Leading Stars for Live Action Movies 92 $1,446,882,355
Top International Leading Stars for Digital Animation Movies 11 $1,720,304,392
Top Worldwide Leading Stars for Live Action Movies 45 $3,759,607,795
Top Worldwide Leading Stars for Digital Animation Movies 11 $2,991,216,581
Top Domestic Leading Stars for Contemporary Fiction Movies 12 $1,623,268,964
Top Domestic Leading Stars for Science Fiction Movies (Rank 601-700) 612 $16,214,356
Top Domestic Leading Stars for Kids Fiction Movies 2 $1,732,651,528
Top Domestic Leading Stars for Historical Fiction Movies (Rank 301-400) 322 $61,543,042
Top Domestic Leading Stars for Fantasy Movies (Rank 101-200) 183 $99,455,084
Top Domestic Leading Stars for Factual Movies 6 $50,504,655
Top International Leading Stars for Contemporary Fiction Movies 65 $932,269,276
Top International Leading Stars for Science Fiction Movies (Rank 401-500) 458 $41,529,445
Top International Leading Stars for Kids Fiction Movies 5 $2,158,388,026
Top International Leading Stars for Historical Fiction Movies (Rank 501-600) 513 $35,000,000
Top Worldwide Leading Stars for Contemporary Fiction Movies 37 $2,555,538,240
Top Worldwide Leading Stars for Science Fiction Movies (Rank 501-600) 524 $57,743,801
Top Worldwide Leading Stars for Kids Fiction Movies 3 $3,891,039,554
Top Worldwide Leading Stars for Historical Fiction Movies (Rank 401-500) 408 $96,543,042
Top Worldwide Leading Stars for Fantasy Movies (Rank 301-400) 336 $99,455,084
Top Worldwide Leading Stars for Factual Movies 19 $50,504,655
Top Domestic Leading Stars for Adventure Movies 19 $1,346,730,183
Top Domestic Leading Stars for Action Movies (Rank 201-300) 215 $301,380,647
Top Domestic Leading Stars for Comedy Movies 2 $1,794,646,773
Top Domestic Leading Stars for Drama Movies (Rank 2,101-2,200) 2,112 $685,780
Top Domestic Leading Stars for Horror Movies (Rank 501-600) 502 $19,637,147
Top Domestic Leading Stars for Romantic Comedy Movies (Rank 101-200) 131 $70,052,444
Top Domestic Leading Stars for Concert/Performance Movies 4 $50,504,655
Top International Leading Stars for Adventure Movies 31 $1,800,237,026
Top International Leading Stars for Action Movies (Rank 501-600) 586 $99,418,685
Top International Leading Stars for Comedy Movies 3 $1,206,531,036
Top International Leading Stars for Romantic Comedy Movies (Rank 101-200) 146 $61,000,000
Top Worldwide Leading Stars for Adventure Movies 26 $3,146,967,209
Top Worldwide Leading Stars for Action Movies (Rank 301-400) 381 $400,799,332
Top Worldwide Leading Stars for Comedy Movies 2 $3,001,177,809
Top Worldwide Leading Stars for Drama Movies (Rank 2,801-2,900) 2,856 $685,780
Top Worldwide Leading Stars for Horror Movies (Rank 601-700) 601 $19,637,147
Top Worldwide Leading Stars for Romantic Comedy Movies (Rank 101-200) 149 $131,052,444
Top Worldwide Leading Stars for Concert/Performance Movies 4 $50,504,655
Top Domestic Leading Stars for PG-13 Movies (Rank 101-200) 135 $811,332,363
Top Domestic Leading Stars for R Movies 11 $1,149,114,914
Top Domestic Leading Stars for PG Movies 5 $1,603,925,050
Top International Leading Stars for PG-13 Movies (Rank 201-300) 298 $578,660,313
Top International Leading Stars for R Movies 59 $619,940,298
Top International Leading Stars for PG Movies 12 $1,968,586,136
Top Worldwide Leading Stars for PG-13 Movies (Rank 201-300) 220 $1,389,992,676
Top Worldwide Leading Stars for R Movies 19 $1,769,055,212
Top Worldwide Leading Stars for PG Movies 5 $3,572,511,186
Top Domestic Leading Stars for Walt Disney Movies (Rank 301-400) 343 $166,340,178
Top Domestic Leading Stars for Warner Bros. Movies (Rank 601-700) 696 $42,359,867
Top Domestic Leading Stars for Universal Movies 41 $460,689,890
Top Domestic Leading Stars for Sony Pictures Movies (Rank 101-200) 175 $137,709,918
Top Domestic Leading Stars for Paramount Pictures Movies 2 $1,797,485,958
Top Domestic Leading Stars for 20th Century Fox Movies 73 $268,910,580
Top International Leading Stars for Walt Disney Movies (Rank 401-500) 459 $79,932,634
Top International Leading Stars for Warner Bros. Movies (Rank 501-600) 566 $43,683,893
Top International Leading Stars for Universal Movies (Rank 101-200) 123 $302,076,376
Top International Leading Stars for Sony Pictures Movies (Rank 201-300) 275 $86,855,491
Top International Leading Stars for Paramount Pictures Movies 5 $1,684,456,287
Top International Leading Stars for 20th Century Fox Movies (Rank 101-200) 160 $251,996,552
Top Worldwide Leading Stars for Walt Disney Movies (Rank 401-500) 402 $246,272,812
Top Worldwide Leading Stars for Warner Bros. Movies (Rank 601-700) 629 $86,043,760
Top Worldwide Leading Stars for Universal Movies 84 $762,766,266
Top Worldwide Leading Stars for Sony Pictures Movies (Rank 201-300) 217 $224,565,409
Top Worldwide Leading Stars for Paramount Pictures Movies 3 $3,481,942,245
Top Worldwide Leading Stars for 20th Century Fox Movies (Rank 101-200) 108 $520,907,132

All Technical Credits

Announced (Undated)

The Pickup

Register with The Numbers for free to customize this chart.

Release
Date
TitleRoleDomestic
Box Office
International
Box Office
Worldwide
Box Office
Dec 1, 2023Candy Cane Lane Producer
Mar 5, 2021Coming 2 America Producer
Character Creator
Oct 11, 2019Dolemite is My Name Producer
Nov 4, 2011Tower Heist Producer $78,046,570$72,376,376$150,422,946
Feb 9, 2007Norbit Screenwriter
Story Creator
$95,673,607$63,300,000$158,973,607
Oct 27, 1995Vampire in Brooklyn Producer
Story by
$19,637,147$19,637,147
Nov 17, 1989Harlem Nights Director
Screenwriter
$60,857,262$35,000,000$95,857,262
Jun 29, 1988Coming to America Story Creator $128,152,301$160,647,699$288,800,000
 
Averages $76,473,377$82,831,019$142,738,192
Totals 8 $382,366,887$331,324,075$713,690,962


Director Credits


Register with The Numbers for free to customize this chart.

Release
Date
TitleOpening
Weekend
Maximum
Theaters
Domestic
Box Office
Worldwide
Box Office
Domestic
Share
Nov 17, 1989Harlem Nights $16,096,8082,180$60,857,262$95,857,26263.5%
 
Averages $16,096,8082,180$60,857,262$95,857,26263.5%
Totals 1 $60,857,262$95,857,262


Producer Credits


Register with The Numbers for free to customize this chart.

Release
Date
TitleOpening
Weekend
Maximum
Theaters
Domestic
Box Office
Worldwide
Box Office
Domestic
Share
Dec 1, 2023Candy Cane Lane
Mar 5, 2021Coming 2 America
Oct 11, 2019Dolemite is My Name
Nov 4, 2011Tower Heist $24,025,1903,370$78,046,570$150,422,94651.9%
Oct 27, 1995Vampire in Brooklyn $7,045,3792,307$19,637,147$19,637,147100.0%
 
Averages $15,535,2852,839$48,841,859$85,030,04775.9%
Totals 5 $97,683,717$170,060,093


Writer Credits


Register with The Numbers for free to customize this chart.

Release
Date
TitleOpening
Weekend
Maximum
Theaters
Domestic
Box Office
Worldwide
Box Office
Domestic
Share
Feb 9, 2007Norbit $34,195,4343,145$95,673,607$158,973,60760.2%
Oct 27, 1995Vampire in Brooklyn $7,045,3792,307$19,637,147$19,637,147100.0%
Nov 17, 1989Harlem Nights $16,096,8082,180$60,857,262$95,857,26263.5%
Jun 29, 1988Coming to America $21,404,4202,064$128,152,301$288,800,00044.4%
 
Averages $19,685,5102,424$76,080,079$140,817,00467.0%
Totals 4 $304,320,317$563,268,016