November 5th, 2012
Madagascar 3: Europe's Most Wanted lived up to its name becoming the best selling new release and earning first place on the DVD sales chart. The film sold 944,000 units and generated $16.03 million in revenue, which was easily enough for first place.
More...
October 16th, 2012
It's a mixed week on the home market. Granted, Madagascar 3: Europe's Most Wanted is coming out, which made more than $200 million domestically and should sell quite well on the home market. On the other hand, the second biggest first run release is That's My Boy, which failed to make an impact at the box office. There is also a flood of weaker releases, secondary Blu-ray releases, and Christmas releases, much of which I would consider filler. The signal to noise ratio is a little off. As for the best releases of the week, there are some great TV on DVD releases like Mad Men: Season Five and Degrassi: Season 11, Part 2. There are also some limited releases, like Moonrise Kingdom on Blu-ray Combo Pack and even some Direct-to-DVD releases, like Excision on Blu-ray. All of these were contenders for Pick of the Week. In the end I went with Mad Men: Season Five for Pick of the week, while Degrassi: Season 11, Part 2 earned Puck of the Week.
More...
October 14th, 2012
2016: Obama's America started out in limited release in the summer, but thanks in part to the GOP convention boosting political enthusiasm among conservatives, it managed to climb into the top ten and expand truly wide. In the end, it became one of the highest grossing political documentaries since Fahrenheit 9/11 set the gold standard for the genre. That film went on to win an Oscar. Will this film do the same?
More...
September 19th, 2012
We had a monster hit on the per theater chart, as The Master earned close to $750,000 in five theaters for an average of $147,262. This is unbelievably strong; however, one does have to take into account the particulars. The Master was released on 70mm and because this is such an unusual event, the tickets were sold at a premium price. The only other film to top the $10,000 mark was Arbitrage, which made just over $2 million in just under 200 theaters for an average of $10,163.
More...
September 12th, 2012
There were three new releases that topped $10,000 on the per theater chart. Detropia led the way with $17,414 in one theater. It should expand, but as a documentary, it will likely not expand wide. Hello I Must Be Going earned an average of $11,952 in two theaters, while Keep the Lights On was right behind with an average of $11,115 in five theaters.
More...
September 5th, 2012
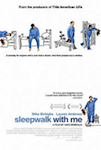
Samsara expanded from two to nine theaters, but held on well enough to rise to top spot on the per theater chart with $12,597. Sleepwalk With Me expanded to 29 theaters and was very solid with an average of $11,127.
More...
August 30th, 2012
It's the Labor Day long weekend, a weekend that a lot of families like to spend outdoors, or on a last minute vacation before school starts. It is generally a bad time to release a film, but three films hope to outperform the historical averages for the weekend. I don't think it will work. The Possession could win the weekend, but Lawless also has a shot. The other wide release, The Oogieloves in the BIG Balloon Adventure, doesn’t have a shot at top spot. It doesn't have a shot at the top ten. It does have a shot at breaking records, on the other hand. As for the holdovers, The Expendables has a shot at the threepeat, but that would be really bad news for the overall box office. Speaking of which, last year, none of the new wide releases were able to crack $10 million, which left The Help in first place. I don't think any film this year will top that film's weekend haul, but overall the depth is better this year and perhaps we can eke out a win in the year-over-year comparison.
More...
August 29th, 2012
Sleepwalk With Me found its way on top of the per theater chart with $68,801 in one theater. This is higher than the per theater average for the opening of The Avengers, which was the goal of the filmmakers after their fake fight with Joss Whedon. Samsara opened with an average of $38,111 in two theaters. The only other film in the $10,000 club was Space Station with $14,268 in one theater.
More...
August 27th, 2012
Ugh. That's really all I have to say. None of the new releases were able to make an impact at the box office; in fact, none of them even reached the top five. There was a new entrant in the top five, as The Dark Knight Rises rose to fifth place. That's how bad the box office was over the weekend. A film that's more than a month old returned to the top five. The best new release was Premium Rush, which only managed eighth place. Overall, the box office plummeted by 30% to just $97 million. Amazingly, this was still higher than the same weekend last year, albeit by just 4.6%. Year-to-date, 2012 maintains its lead over 2011. It is ahead of last year's pace by 4.2% at $7.43 billion to $7.13 billion.
More...
August 26th, 2012
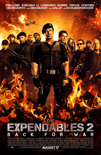
The Summer box office season will come to an abrupt halt this weekend as returning films dominate the chart thanks to some decidedly lackluster openings. The top holdover, The Expendables 2, will win by default with a decent second weekend of $13.5 million, according to Lionsgate's Sunday morning estimate. That's down a fairly respectable 53% from its debut figure. The standout performer among returning films is political documentary 2016: Obama's America, which is projected to earn $6.2 million from 1,091 theaters -- the best per theater average in the top 10. That film will end up in 8th place, though, after an impressive 4th place on Friday, suggesting that it has a fairly narrow, if enthusiastic, fan base.
More...
August 22nd, 2012
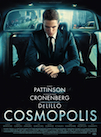
Cosmopolis led the way on the per theater chart with an excellent opening of $70,000 in three theaters for an average of $23,446. Given its reviews, I'm not sure it will do well as it expands. Robot and Frank was also strong with an average of $17,770 in two theaters, while Compliance was right behind with $16,427 in one theater. Ek Tha Tiger didn't quite reach the $10,000 club over the weekend with an average of $9,655, but it was a Wednesday release, so had it opened on Friday, it likely would have easily made the cut.
More...
August 19th, 2012
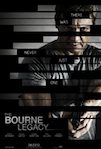
The Expendables 2 will enjoy a comfortable win at the box office this weekend, even though its debut number looks as though it will fall somewhat behind the first film in the franchise. Lionsgate currently has the film pegged at $28.75 million for the weekend, well ahead of The Bourne Legacy's $17 million second weekend. ParaNorman will scare up about $14 million for third place, and a total of seven films will top $10 million this weekend, including the two other debutants, Sparkle (which is set for $12 million, per Sony), and The Odd Life of Timothy Green (shooting for $10.9 million, according to Disney).
More...
August 12th, 2012
After another lengthy run for the country's number one film, we will have a new top movie this weekend thanks to a strong debut for The Bourne Legacy, which will beat The Dark Knight Rises after Batman spent three weekends atop the chart. Universal is predicting that their franchise reboot will pick up about $40.3 million this weekend, somewhat behind The Bourne Legacy's $69.2 million debut, but very creditable for movie that takes the franchise in a new direction. Even better for the overall market, The Campaign is predicted to post $27.4 million for Warner Bros., which will be enough for second place.
More...
July 17th, 2012
One of two Obama related films topped the per theater chart this past weekend. 2016 earned $31,610 in its lone theater, which suggests potential to earn some measure of mainstream success; however, documentaries rarely get too far. The Imposter earned $22,379, also in one theater. This also suggests some potential, but again, it is a documentary. Easy Money earned an average of $12,342 in two theaters, while Ice Age: Continental Drift was right behind with an average of $12,015.
More...