Viola Davis

Viola Davis
Chrisa Hickey [CC-BY-3.0], via Wikimedia Commons
Best known as a Supporting Actress based on credits in that role in 21 films, with $1,568,233,543 worldwide aggregate box office (rank #1,417)
Best-known acting roles: Amanda Waller (Suicide Squad), (The Hunger Games: The Ballad of Songbirds & Snakes), The Chameleon (Kung Fu Panda 4), Aibileen (The Help), Nanisca (The Woman King)
Best-known technical roles: The Woman King (Producer), Lila & Eve (Executive Producer)
Most productive collaborators: Will Smith, David Ayer, Margot Robbie, Jared Leto, Charles Roven
Born: August 11, 1965 (58 years old)
Also credited as: Viola Shiraz
                                    

  1. Summary
  2. News
  3. Acting Credits
  4. Technical Credits

Career Summary


  MoviesDomestic
Box Office
International
Box Office
Worldwide
Box Office
As an ActorSupporting21$777,580,952$790,652,591$1,568,233,543
Lead Ensemble Member8$723,320,140$870,559,838$1,593,879,978
Leading7$333,511,908$97,240,593$430,752,501
Inverviewee2$16,164$0$16,164
(Unclassified)3$106,423,922$13,126,065$119,549,987
In Technical RolesProducer3$67,328,130$27,046,619$94,374,749
Executive Producer2$38,263$0$38,263

Career Trend

This graph shows Viola Davis’s score on our annual analysis of leading stars at the box office. The Star Score represents points assigned to each of the leading stars of the top 100 movies (based on box office) in the current year and two preceding years. For appearing in the number one movie in a year a star gets 100 points, the number two movie 99 points and so on..

Latest Ranking on Selected Box Office Record Lists


RecordRankAmount
Top 100 Stars in Leading Roles at the Domestic Box Office (Rank 101-200) 199 $1,056,832,048
Top Stars at the Domestic Box Office (Rank 301-400) 392 $1,940,703,361
Top 100 Stars in Leading Roles at the International Box Office (Rank 301-400) 327 $967,800,431
Top Stars at the International Box Office (Rank 701-800) 755 $1,771,642,087
Top 100 Stars in Leading Roles at the Worldwide Box Office (Rank 201-300) 253 $2,024,632,479
Top Stars at the Worldwide Box Office (Rank 501-600) 534 $3,712,345,448
Highest Grossing Stars of 2022 at the Domestic Box Office 30 151
Highest Grossing Stars of 2023 at the Domestic Box Office 2 290
Highest Grossing Stars of 2024 at the Domestic Box Office 6 212
Highest Grossing Stars of 2023 at the International Box Office 24 164
Highest Grossing Stars of 2024 at the International Box Office 87 95
Highest Grossing Stars of 2022 at the Worldwide Box Office 29 126
Highest Grossing Stars of 2023 at the Worldwide Box Office 5 230
Highest Grossing Stars of 2024 at the Worldwide Box Office 23 156
Top Grossing Executive Producer at the Domestic Box Office (Rank 8,601-8,700) 8,618 $38,263
Top Grossing Producer at the Domestic Box Office (Rank 1,401-1,500) 1,456 $67,328,130
Top Grossing Producer at the International Box Office (Rank 2,301-2,400) 2,323 $27,046,619
Top Grossing Executive Producer at the Worldwide Box Office (Rank 10,601-10,700) 10,661 $38,263
Top Grossing Producer at the Worldwide Box Office (Rank 1,801-1,900) 1,857 $94,374,749

See the Acting Credits tab for all Acting Box Office Records and the Technical Credits tab for all Technical Box Office Records.


Theater counts: Dune narrowly holds off Kung Fu Panda to remain widest release

March 7th, 2024

Dune: Part Two

After a successful opening week at the worldwide box office, Dune: Part Two adds three locations this week, once again taking the top spot on our theater count chart by playing in 4,074 theaters. Domestically, the sequel scored $82.5 million during its opening weekend and passed the $100-million mark on Wednesday, clocking with with a six-day domestic total of $104.62 million. The film’s opening weekend figure doubled that of its predecessor’s $41 million. This week will pose a much bigger challenge however as three new wide releases make their debut on the big screen. More...

Theater Counts: Jungle Cruise sets new pandemic-era record for widest release

July 29th, 2021

Jungle Cruise

Walt Disney’s release of Jungle Cruise breaks a pandemic-era record for widest release, arriving in 4,310 theaters this weekend. The number matches that of another Disney feature, Onward, which debuted just before theaters began shutting down back in March, 2020. The new film, which is based on the popular theme park attraction, follows Dwayne Johnson and Emily Blunt as Amazon riverboat captain Frank Wolff and Dr. Lily Houghton as they encounter innumerable dangers while they travel through the Amazon rain forest. Jungle Cruise will be available to stream simultaneously on the Disney+ platform. More...

The Suicide Squad Preview

August 27th, 2020

Superhero action movie starring Margot Robbie, Viola Davis, Joel Kinnaman, Jai Courtney, Idris Elba, and John Cena opens August 6, 2021 ... Full Movie Details. More...

2018 - Awards Season: BAFTA - Nominations

January 12th, 2019

The Favorite

The BAFTA nominations were announced and The Favorite led the way with 12 nominations. Sometimes the BAFTAs are a really good indicator for who will do well on Oscar night. Other times their bias to British films is too much. I think this year will be an example of the latter and I don't think The Favourite is suddenly an Oscar favorite. That said, there’s still some things you can learn here. More...

2018 Preview: November

November 1st, 2018

Ralph Breaks the Internet

October continued 2018’s phenomenal box office run, for the most part. There were a couple of films that missed expectations by $10 million or more, but on the other hand, Vemon and Halloween were smash hits and are now the first and second biggest October debuts of all time. Furthermore, 2018’s lead over 2017 is, as I’m writing this, just shy of $1 billion and if 2018 can maintain this lead, it will be one of the biggest year-over-year increases of all time. It won’t. The fun times end now. Why is that? Last November was amazing. There were only eight wide releases, but six of them earned more than $100 million. Three of those hit $200 million, including Thor: Ragnarok, which earned over $300 million. This year, there are a lot more movies opening in November, but it is a case of quantity over quality. No movie is expected to come close to $300 million and it would take a bit of luck just to have five $100 million hits. The film I’m looking forward to the most is Ralph Breaks the Internet, while it, Dr. Seuss’ The Grinch, and Fantastic Beasts: The Crimes of Grindelwald are all aiming for $200 million this month. Fortunately, even if 2018 is behind 2017’s pace by around $300 million, 2018 has built up such a large lead that it should still go into December with an insurmountable lead at the box office. More...

Widows Trailer

August 15th, 2018

Thriller starring Viola Davis, Elizabeth Debicki, Michelle Rodriguez, and Cynthia Erivo opens November 16 ... Full Movie Details.

The story of four women with nothing in common except a debt left behind by their dead husbands’ criminal activities. Set in contemporary Chicago, amid a time of turmoil, tensions build when Veronica, Alice, Linda and Belle take their fate into their own hands and conspire to forge a future on their own terms. More...

Home Market Releases for March 14th, 2017

March 15th, 2017

The Love Witch

There are a few Oscar-nominated films on this week’s list. However, it was still hard to come up with a Pick of the Week release. Most of them were like Elle with great reviews and weak extras. The DVD for Drunk History: Season Four has more than two hours of extras, but I admit it is an acquired taste. Fortunately, we do have a clear winner: The Love Witch on Blu-ray. More...

2016 Awards Season: A Final Look at the Oscars

February 27th, 2017

Moonlight

Oscar night turned out to be... interesting at the end. “Interesting” as in “May you live in interesting times.” The big winner of the night was chaos, as there was a mistake with the Best Picture category. (On a side note, I really hope this ends the conspiracy theory that Marisa Tomei didn’t earn her Oscar. Some think her name was announced by accident and they didn’t bother to correct the mistake. They would have obviously corrected the mistake.) On a serious note, Moonlight’s win is amazing. It has likely the lowest budget of the nine Best Picture Nominees and at the moment the lowest box office. That could change with its three wins last night. Additionally, all three wins came from high prestige categories, compared to just two for La La Land. However, La La Land won six Oscars overall, two high prestige, both music categories, and two technical awards, so it too could be seen as the big winner of the night. More...

2016 - Awards Season - And the Oscar Goes to... La La Land Moonlight!

February 26th, 2017

Moonlight

It’s Oscar night and we were live blogging the show. Read on the the highlights of what turned out to be a crazy night. More...

Oscar Predictions: La La Land Favorite to Win Nine Oscars Tonight

February 26th, 2017

Best Picture Nominees

Voting in our annual Predict the Academy Awards contest is now closed, and we can reveal the final vote totals in each category, along with the rough probability for which film will win each award. This year’s award nominations have been dominated by La La Land, and it is expected to pick up the most Oscars tonight, with Best Picture among them. It has already equalled the record for most nominations, with 14, but it’s not favored to equal or set the record for most wins, with our poll suggesting it will pick up nine awards. Read on for details of our poll.

- Predicted winners in each category
- Total votes in each category
- Predicted and actual winners in each category More...

2016 - Awards Season: Oscars - Nominations - Final Look

February 26th, 2017

La La Land

It’s Oscar night and we will be live blogging the show. Before that, let’s take a last look at the nominations with a few annotations. Nominees in italics are those that have received the most votes from our readers so far in our Oscar contest (which is open to new entries until noon, Pacific, today—enter now!). Bold films are those films I think will win. Meanwhile, those that are Underlined are those I want to win. Not all categories have underlined nominees, because not all categories have someone I’m cheering for, or because there are two nominees I couldn’t pick between. More...

2016 Awards Season: Oscar Highlight: Best Picture

February 24th, 2017

La La Land

With our annual Oscar Prediction contest underway, now is the best time to look at the nominees and try and figure out who the favorites are and which films should just feel honored to be nominated. Today we look at the final category: Best Picture. It is not a competitive category with an overwhelming favorite, a long shot with a shot, and then rest have maybe a combined 2% chance of winning. More...

2016 Awards Season: Oscar Highlight: Best Supporting Actress

February 15th, 2017

Fences

With our annual Oscar Prediction contest underway, now is the best time to look at the nominees and try and figure out who the favorites are and which films should just feel honored to be nominated. Today we look at the Supporting Roles categories, starting with Best Supporting Actress. In this category, we have one overwhelming favorite, a long shot with a shot, and then everyone else. More...

2016 - Awards Season: BAFTA - Winners - La La Lands on Top, Again

February 12th, 2017

La La Land

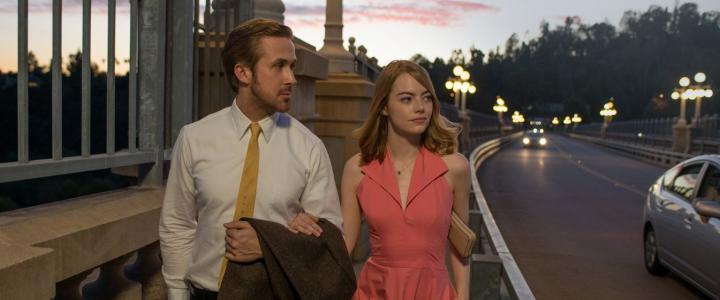
The BAFTA winners were announced on Sunday and there were very few surprises to talk about. La La Land again won the most awards with five, while only two other films, Lion and Manchester by the Sea, earned more than one award. They each won two. More...

2016 - Awards Season: SAG - Winners

January 29th, 2017

Fences

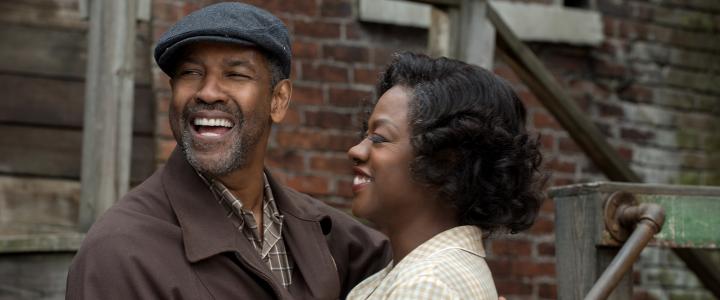
The Screen Actors Guild were handed out tonight and there were a couple of surprises to talk about. There was no one big winner. Hidden Figures won the most prestigious category, but Fences was the only film with multiple wins. More...

2016 Awards Season: Oscar Nominations

January 24th, 2017

La La Land

The Oscar nominations were announced starting at 5:18 am Pacific time. Nothing is good that early in the morning. Worse still, it’s a boring year for nominations with very few surprises worth talking about, especially in the biggest categories. Leading the way was La La Land with 14 nominations, tying the record. More...

2016 - Awards Season: BAFTA - Nominations

January 11th, 2017

La La Land

The BAFTA nominations were announced and it should come as no surprise what film lead the way... La La Land with 11 nominations, Nocturnal Animals and Arrival are tied for second with nine nominations a piece. More...

2016 - Awards Season: Golden Globes - Winners - La La Lands on Top

January 8th, 2017

La La Land

The first major awards night was Sunday with the Golden Globes being handed out. La La Land led the way with seven wins, winning in every category it was nominated in. This is great news for its Oscar chances, but there’s already backlash building. More...

2016 - Awards Season: SAG - Nominations

December 14th, 2016

Manchester by the Sea

The Screen Actors Guild were the third group to announce their nominations for this awards season. So far there have been three different films earning the most nominations. This could mean the Oscar race will be a lot closer than in past years. This time around Manchester by the Sea led the way with four nominations. More...

2016 - Awards Season: Golden Globes - Nominations

December 12th, 2016

La La Land

The Golden Globes nominations were announced and we are starting to see a few names pop up over and over again. La La Land led the way with seven nominations, but Moonlight was right behind with six and Manchester by the Sea earned five. You will be hearing those three names over and over and over again this Awards Season. More...

2016 Preview: December

December 1st, 2016

Rogue One: A Star Wars Story

November was good, but not great. Fortunately, 2016 had a large enough lead going into November that the month only needed to be good. In fact, it could have been mediocre and 2016 would have still had an excellent shot to end the year above 2015. As for December, it’s a race between Star Wars and Star Wars. Almost no one thinks Rogue One is going to match The Force Awakens, but if Rogue One earns just half of what The Force Awakens managed, then 2016 will come out on top in the year-over-year comparison. There are only two other films with a better than 50/50 chance of hitting $100 million, Passengers and Sing. Either one could earn second place for the month, but Passengers will likely start faster. Last December, the only other film to earn more than $100 million was Daddy’s Home, which earned just a hair over $150 million. There’s a chance both Passengers and Sing will earn more than $150 million, which would be a boon to the box office. However, Star Wars: The Force Awakens was just too strong last year and it would take a miracle for 2016 to have a stronger December. That said, it would take a complete collapse for 2016 not to top 2015 in raw dollars. The growth might not be enough to keep pace with ticket price inflation, on the other hand. More...

Featured VOD Review: Suicide Squad

November 28th, 2016

Suicide Squad

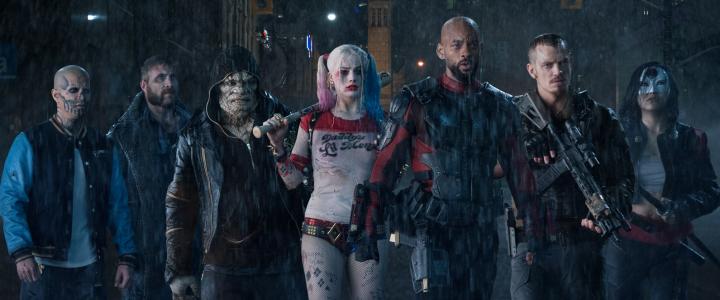
After Superman Returns struggled at the box office and The Dark Knight became a surprise $1 billion hit, the folks at Warner Bros. decided to reboot the D.C. movies as D.C. Extended Universe using the dark and gritty style of the Dark Knight Trilogy. That hasn’t worked out so far. Man of Steel barely broke even and the mixed reviews made a few people worried about the franchise’s future. The dour interpretation of Superman didn’t work and the editing and pacing was a mess, but at least it had an interesting villain. Batman v Superman was terrible and had one of the worst villains of any comic book movie I’ve seen. When that film was eviscerated by the critics, Warner Bros. stepped in and made last minute changes to Suicide Squad. Did it work? Nope. But is it better than BvS? More...

2016 Preview: August

August 1st, 2016

Suicide Squad

July did reasonably well, thanks mostly to The Secret Life of Pets, which will top $300 million shortly and could earn double its nearest competitor when all is said and done. That said, there were also a quartet of $100 million hits as well, so the month had good depth as well. August isn’t as lucky. There is one film that is expected to earn $100 million during its opening weekend, Suicide Squad, and one more that is expected to reach $100 million in total, Pete’s Dragon. There could be a surprise hit among the rest of the releases, (my long shot with a shot is Sausage Party) but for the most part, the rest of the wide releases would be happy with just $50 million at the box office. Last August was a disaster and Straight Outta Compton was the only hit of the month. Unless Suicide Squad bombs compared to expectations, 2016 will come out ahead in the year-over-year comparison. More...

Home Market Releases for June 21st, 2016

June 20th, 2016

Fantastic Planet

There are two wide releases coming out this week, My Big Fat Greek Wedding 2 and The Divergent Series: Allegiant, although the latter is only coming out on Video on Demand. Neither of these are big releases and it only gets much worse from there. There wasn't a lot of competition for Pick of the Week, but I went with Fantastic Planet: Criterion Collection. It's a classic, but it is also a French Surrealist animated film, so that will limit its target audience. More...

Home Market Releases for August 4th, 2015

August 4th, 2015

Orphan Black

For a summer week, there's a surprising strength on top of the home market releases. Insurgent will very likely be the top selling DVD or Blu-ray on this week's list, but it isn't even close to the best. There were five contenders for Pick of the Week, three of which were in the TV on DVD category. This includes the eventual winner, Orphan Black: Season Three. More...

Limited and VOD Releases: Holmes is on the Case

July 17th, 2015

Mr. Holmes

There are very few films on this week's list that have a real shot at earning mainstream success. I would like to think Court or A Hard Day could do so, but they are both foreign-language films and that's usually too big of an obstacle to overcome. Mr. Holmes has both the cast and the reviews to thrive, but it is playing in more than 300 theaters. That might be too many to thrive. Let's hope I'm being too pessimistic. More...

2015 Preview: January

January 1st, 2015

Taken 3 poster

2014 is over and for the most part, December was a soft ending to a weak year. This is bad news for two reasons. Firstly, it means the overall box office is still soft and it is unlikely that January will start strong. Secondly, last January was a great month, thanks in part to Frozen and other holdovers. The slump can't last forever and Taken 3 should help 2015 get off to a reasonably fast start and it even has a shot at $100 million. American Sniper got off to a really fast start in limited release, so it too could be a hit when it expands wide. By comparison, last January was led by Ride Along, but there were only two other films that didn't completely bomb. I want to say 2015 will start out on a winning note, but given the box office losing streak, it will likely pay to be pessimistic. More...

2014 Preview: August

August 1st, 2014

Guardians of the Galaxy poster

July was... well... let's just pretend it didn't happen. Dawn of the Planet of the Apes did well, but week after week 2014 fell further behind 2013 in the year-to-date comparison. At the moment, we are roughly $400 million behind last year's pace and while I don't think August will continue the losing streak, there's really no chance August will put a dent in that number. It looks more and more likely that Guardians of the Galaxy will be a hit, especially given its early reviews, but it could be the last $100 million hit till October, if the bad buzz surrounding Teenage Mutant Ninja Turtles turns into bad ticket sales. Last August there were two films that reached $100 million, plus two others that came close. This August might match that, while the biggest film this year should top the biggest film from last year. I think the slump 2014 is suffering through will end the first weekend and overall I think it will cut the deficit a little bit. That said, summer 2014 will still end as one of the worst recent summers at the box office. More...

2013 Preview: November

November 1st, 2013

October ended on a winning note, but it was the only time the entire month that 2013 topped 2012 in the year-over-year comparison. This is quite shocking, as Gravity crushed expectations with more than $200 million and counting. Even with that surprise monster hit, the month still couldn't keep pace with last year. Compared to October, November looks a lot better with three films that could be monster hits: Frozen, Thor: The Dark World, and The Hunger Games: Catching Fire. On the other hand, those are the only three movies with a 50/50 chance or better to top $100 million compared, while there were seven films that reached that milestone last November. The Hunger Games: Catching Fire should make more than last year's number one film, Skyfall, but the depth last year could prove too much to deal with. 2013 might dip below last year's pace sometime during the month, but hopefully it won't stay there too long. More...

Weekend Predictions: Prisoners Free to Capture Top Spot

September 20th, 2013

There might be a close race at the box office this weekend. The buzz surrounding Prisoners is growing enough that it should earn first place, but Insidious Chapter 2 might hold on well enough to challenge the newcomer for top spot. The other new release for the week is Battle of the Year, which is opening in fewer theaters than I thought it would and with much worse reviews. It likely won't be a factor. In fact, there's a slim chance that the 3-D re-release of The Wizard of Oz will earn more this weekend than Battle of the Year will. The best new releases from this week last year was End of Watch, which only managed $13.15 million. This is close to what it cost to make, but it is low for a number one film. On the other hand, last year had much better depth than this year will have, so 2013's winning streak might come to an end. More...

All Acting Credits


Register with The Numbers for free to customize this chart.

Release
Date
TitleRoleDomestic
Box Office
International
Box Office
Worldwide
Box Office
Mar 8, 2024Kung Fu Panda 4 The Chameleon $107,893,725$68,692,000$176,585,725
Nov 17, 2023The Hunger Games: The … $166,350,594$160,987,542$327,338,136
Apr 5, 2023AIR $52,460,106$36,988,160$89,448,266
Sep 16, 2022The Woman King Nanisca $67,328,130$27,046,619$94,374,749
Dec 10, 2021The Unforgivable $13,023$13,023
Aug 5, 2021The Suicide Squad Amanda Waller $55,817,425$111,280,312$167,097,737
Dec 18, 2020Ma Rainey’s Black Bott… Ma Rainey
Jun 19, 2020Creating a Character: … Herself
Jan 17, 2020Troop Zero Miss Rayleen
Nov 16, 2018Widows Veronica Rawlins $42,402,632$33,582,068$75,984,700
Dec 16, 2016Fences Rose $57,682,904$6,599,977$64,282,881
Aug 5, 2016Suicide Squad Amanda Waller $325,100,054$420,644,926$745,744,980
UnknownCustody Martha Schulman
Jul 17, 2015Lila & Eve Lila $38,263$38,263
Jan 16, 2015Blackhat Carol Barrett $8,005,980$11,659,024$19,665,004
Aug 1, 2014Get on Up Susie Brown $30,569,935$2,769,933$33,339,868
Feb 3, 2014The Disappearance of E… Professor Friedman $587,152$1,237,989$1,825,141
Nov 1, 2013Ender’s Game Major Anderson $61,737,191$66,246,092$127,983,283
Sep 20, 2013Prisoners Nancy Birch $61,002,302$52,308,245$113,310,547
Apr 5, 2013Love, Marilyn Herself $16,164$16,164
Feb 14, 2013Beautiful Creatures Amma $19,452,138$40,830,738$60,282,876
Sep 28, 2012Won't Back Down Nona Alberts $5,310,554$434,949$5,745,503
Dec 25, 2011Extremely Loud and Inc… Abby Black $31,847,881$23,400,000$55,247,881
Aug 10, 2011The Help Aibileen $169,705,587$43,414,417$213,120,004
Apr 1, 2011Trust Gail Friedman $120,016$120,016
Oct 8, 2010It's Kind of a Funny S… Dr. Eden Minerva $6,363,628$269,322$6,632,950
Aug 13, 2010Eat Pray Love Delia Shiraz $80,574,010$126,024,779$206,598,789
Jun 23, 2010Knight and Day Director George $76,423,035$182,328,335$258,751,370
Oct 16, 2009Law Abiding Citizen Mayor $73,357,727$57,802,054$131,159,781
Apr 17, 2009State of Play Dr. Judith Franklin $37,017,955$51,814,255$88,832,210
Feb 20, 2009Madea Goes To Jail $90,508,336$90,508,336
Dec 12, 2008Doubt $33,446,470$19,744,631$53,191,101
Sep 26, 2008Nights in Rodanthe Jean $41,850,659$37,500,000$79,350,659
Dec 1, 2006The Architect Tonya Neeley $13,737$13,737
Aug 9, 2006World Trade Center Mother in Hospital $70,278,893$93,016,761$163,295,654
Nov 9, 2005Get Rich or Die Tryin' Grandma $30,981,850$15,685,105$46,666,955
Dec 19, 2002Antwone Fisher Eva $21,078,145$2,289,441$23,367,586
Nov 27, 2002Solaris Gordon $14,970,038$14,970,038
Nov 8, 2002Far From Heaven Sybil $15,901,849$13,126,065$29,027,914
Dec 25, 2001Kate and Leopold Policewoman $47,095,453$23,842,325$70,937,778
Jun 26, 1998Out of Sight Moselle $37,562,568$40,000,000$77,562,568
 
Averages $53,912,586$57,147,712$100,336,005
Totals 41 $1,940,853,086$1,771,579,087$3,712,432,173


Leading or Lead Ensemble Roles


Register with The Numbers for free to customize this chart.

Release
Date
TitleOpening
Weekend
Maximum
Theaters
Domestic
Box Office
Worldwide
Box Office
Domestic
Share
Nov 17, 2023The Hunger Games: The … $44,607,1433,776$166,350,594$327,338,13650.8%
Apr 5, 2023AIR $14,456,2793,507$52,460,106$89,448,26658.6%
Sep 16, 2022The Woman King $19,051,4423,765$67,328,130$94,374,74971.3%
Aug 5, 2021The Suicide Squad $26,205,4154,019$55,817,425$167,097,73733.4%
Dec 18, 2020Ma Rainey’s Black Bott…
Nov 16, 2018Widows $12,361,3072,803$42,402,632$75,984,70055.8%
Dec 16, 2016Fences $129,4622,368$57,682,904$64,282,88189.7%
Aug 5, 2016Suicide Squad $133,682,2484,255$325,100,054$745,744,98043.6%
UnknownCustody
Jul 17, 2015Lila & Eve $21,80622$38,263$38,263100.0%
Nov 1, 2013Ender’s Game $27,017,3513,407$61,737,191$127,983,28348.2%
Feb 14, 2013Beautiful Creatures $7,582,5952,950$19,452,138$60,282,87632.3%
Sep 28, 2012Won't Back Down $2,603,3702,517$5,310,554$5,745,50392.4%
Aug 10, 2011The Help $26,044,5903,014$169,705,587$213,120,00479.6%
Dec 12, 2008Doubt $507,2261,287$33,446,470$53,191,10162.9%
 
Averages $24,174,6332,899$81,294,773$155,740,96063.0%
Totals 15 $1,056,832,048$2,024,632,479


Supporting Roles


Register with The Numbers for free to customize this chart.

Release
Date
TitleOpening
Weekend
Maximum
Theaters
Domestic
Box Office
Worldwide
Box Office
Domestic
Share
Mar 8, 2024Kung Fu Panda 4 $57,989,9054,067$107,893,725$176,585,72561.1%
Dec 10, 2021The Unforgivable $13,023
Jan 17, 2020Troop Zero
Jan 16, 2015Blackhat $3,901,8152,568$8,005,980$19,665,00440.7%
Aug 1, 2014Get on Up $13,585,9152,469$30,569,935$33,339,86891.7%
Feb 3, 2014The Disappearance of E… $77,181139$587,152$1,825,14132.2%
Sep 20, 2013Prisoners $20,817,0533,290$61,002,302$113,310,54753.8%
Dec 25, 2011Extremely Loud and Inc… $72,3482,630$31,847,881$55,247,88157.6%
Apr 1, 2011Trust $58,21428$120,016$120,016100.0%
Oct 8, 2010It's Kind of a Funny S… $2,013,406757$6,363,628$6,632,95095.9%
Aug 13, 2010Eat Pray Love $23,104,5233,108$80,574,010$206,598,78939.0%
Jun 23, 2010Knight and Day $20,139,9853,104$76,423,035$258,751,37029.5%
Oct 16, 2009Law Abiding Citizen $21,039,5022,890$73,357,727$131,159,78155.9%
Apr 17, 2009State of Play $14,071,2802,807$37,017,955$88,832,21041.7%
Sep 26, 2008Nights in Rodanthe $13,418,4542,704$41,850,659$79,350,65952.7%
Aug 9, 2006World Trade Center $18,730,7623,021$70,278,893$163,295,65443.0%
Nov 9, 2005Get Rich or Die Tryin' $12,020,8071,666$30,981,850$46,666,95566.4%
Dec 19, 2002Antwone Fisher $210,0131,021$21,078,145$23,367,58690.2%
Nov 27, 2002Solaris $6,752,7222,406$14,970,038$14,970,038100.0%
Dec 25, 2001Kate and Leopold $9,725,4082,467$47,095,453$70,937,77866.4%
Jun 26, 1998Out of Sight $12,020,4352,112$37,562,568$77,562,56848.4%
 
Averages $13,144,7232,277$40,925,313$78,411,67761.4%
Totals 21 $777,580,952$1,568,233,543

Latest Ranking on All Acting Box Office Record Lists


RecordRankAmount
Top 100 Stars in Leading Roles at the Domestic Box Office (Rank 101-200) 199 $1,056,832,048
Top 100 Stars in Supporting Roles at the Domestic Box Office (Rank 1,001-1,100) 1,071 $777,431,227
Top Live Action Stars at the Domestic Box Office (Rank 201-300) 299 $1,832,959,361
Top Above the Line Stars at the Domestic Box Office (Rank 201-300) 238 $1,547,888,698
Top Below the Line Stars at the Domestic Box Office (Rank 4,201-4,300) 4,228 $286,390,741
Top Stars at the Domestic Box Office (Rank 301-400) 392 $1,940,703,361
Top 100 Stars in Leading Roles at the International Box Office (Rank 301-400) 327 $967,800,431
Top 100 Stars in Supporting Roles at the International Box Office (Rank 1,901-2,000) 1,972 $790,715,591
Top Live Action Stars at the International Box Office (Rank 501-600) 576 $1,702,887,087
Top Above the Line Stars at the International Box Office (Rank 401-500) 432 $1,489,751,186
Top Below the Line Stars at the International Box Office (Rank 6,901-7,000) 6,904 $268,764,836
Top Stars at the International Box Office (Rank 701-800) 755 $1,771,642,087
Top 100 Stars in Leading Roles at the Worldwide Box Office (Rank 201-300) 253 $2,024,632,479
Top 100 Stars in Supporting Roles at the Worldwide Box Office (Rank 1,401-1,500) 1,417 $1,568,146,818
Top Live Action Stars at the Worldwide Box Office (Rank 401-500) 415 $3,535,846,448
Top Above the Line Stars at the Wordwide Box Office (Rank 301-400) 342 $3,037,639,884
Top Below the Line Stars at the Worldwide Box Office (Rank 5,301-5,400) 5,388 $555,155,577
Top Stars at the Worldwide Box Office (Rank 501-600) 534 $3,712,345,448
Highest Grossing Stars of 2008 at the Domestic Box Office (Rank 301-400) 340 16
Highest Grossing Stars of 2009 at the Domestic Box Office (Rank 301-400) 370 16
Highest Grossing Stars of 2010 at the Domestic Box Office (Rank 401-500) 403 16
Highest Grossing Stars of 2011 at the Domestic Box Office (Rank 101-200) 148 88
Highest Grossing Stars of 2012 at the Domestic Box Office (Rank 101-200) 154 88
Highest Grossing Stars of 2013 at the Domestic Box Office 89 132
Highest Grossing Stars of 2014 at the Domestic Box Office (Rank 301-400) 374 44
Highest Grossing Stars of 2015 at the Domestic Box Office (Rank 301-400) 369 44
Highest Grossing Stars of 2016 at the Domestic Box Office 69 136
Highest Grossing Stars of 2017 at the Domestic Box Office 88 136
Highest Grossing Stars of 2018 at the Domestic Box Office 83 166
Highest Grossing Stars of 2019 at the Domestic Box Office (Rank 501-600) 546 30
Highest Grossing Stars of 2020 at the Domestic Box Office (Rank 401-500) 477 30
Highest Grossing Stars of 2021 at the Domestic Box Office (Rank 201-300) 223 78
Highest Grossing Stars of 2022 at the Domestic Box Office 30 151
Highest Grossing Stars of 2023 at the Domestic Box Office 2 290
Highest Grossing Stars of 2024 at the Domestic Box Office 6 212
Highest Grossing Stars of 2011 at the International Box Office (Rank 401-500) 419 9
Highest Grossing Stars of 2012 at the International Box Office (Rank 401-500) 464 9
Highest Grossing Stars of 2013 at the International Box Office (Rank 301-400) 378 41
Highest Grossing Stars of 2014 at the International Box Office (Rank 401-500) 415 32
Highest Grossing Stars of 2015 at the International Box Office (Rank 301-400) 391 32
Highest Grossing Stars of 2016 at the International Box Office (Rank 101-200) 137 89
Highest Grossing Stars of 2017 at the International Box Office (Rank 101-200) 156 89
Highest Grossing Stars of 2018 at the International Box Office (Rank 101-200) 184 89
Highest Grossing Stars of 2021 at the International Box Office (Rank 201-300) 210 69
Highest Grossing Stars of 2022 at the International Box Office (Rank 101-200) 122 89
Highest Grossing Stars of 2023 at the International Box Office 24 164
Highest Grossing Stars of 2024 at the International Box Office 87 95
Highest Grossing Stars of 2008 at the Worldwide Box Office (Rank 301-400) 345 7
Highest Grossing Stars of 2009 at the Worldwide Box Office (Rank 301-400) 393 7
Highest Grossing Stars of 2010 at the Worldwide Box Office (Rank 401-500) 417 7
Highest Grossing Stars of 2011 at the Worldwide Box Office (Rank 201-300) 218 71
Highest Grossing Stars of 2012 at the Worldwide Box Office (Rank 201-300) 203 71
Highest Grossing Stars of 2013 at the Worldwide Box Office 92 116
Highest Grossing Stars of 2014 at the Worldwide Box Office (Rank 301-400) 349 45
Highest Grossing Stars of 2015 at the Worldwide Box Office (Rank 301-400) 350 45
Highest Grossing Stars of 2016 at the Worldwide Box Office (Rank 101-200) 145 91
Highest Grossing Stars of 2017 at the Worldwide Box Office (Rank 101-200) 159 91
Highest Grossing Stars of 2018 at the Worldwide Box Office (Rank 101-200) 158 94
Highest Grossing Stars of 2019 at the Worldwide Box Office (Rank 501-600) 593 3
Highest Grossing Stars of 2020 at the Worldwide Box Office (Rank 501-600) 566 3
Highest Grossing Stars of 2021 at the Worldwide Box Office (Rank 201-300) 209 74
Highest Grossing Stars of 2022 at the Worldwide Box Office 29 126
Highest Grossing Stars of 2023 at the Worldwide Box Office 5 230
Highest Grossing Stars of 2024 at the Worldwide Box Office 23 156
Top Domestic Leading Stars for Original Screenplay Movies (Rank 2,801-2,900) 2,887 $5,348,817
Top Domestic Leading Stars for Based on Fiction Book/Short Story Movies 75 $417,245,510
Top Domestic Leading Stars for Based on Comic/Graphic Novel Movies (Rank 101-200) 101 $380,917,479
Top Domestic Leading Stars for Based on Real Life Events Movies 50 $119,788,236
Top Domestic Leading Stars for Based on TV Movies (Rank 201-300) 285 $42,402,632
Top Domestic Leading Stars for Based on Play Movies 21 $91,129,374
Top International Leading Stars for Original Screenplay Movies (Rank 4,001-4,100) 4,015 $434,949
Top International Leading Stars for Based on Fiction Book/Short Story Movies (Rank 101-200) 178 $311,478,789
Top International Leading Stars for Based on Comic/Graphic Novel Movies (Rank 101-200) 103 $531,925,238
Top International Leading Stars for Based on Real Life Events Movies (Rank 101-200) 118 $64,034,779
Top International Leading Stars for Based on TV Movies (Rank 201-300) 274 $33,582,068
Top International Leading Stars for Based on Play Movies 46 $26,344,608
Top Worldwide Leading Stars for Original Screenplay Movies (Rank 3,601-3,700) 3,696 $5,783,766
Top Worldwide Leading Stars for Based on Fiction Book/Short Story Movies (Rank 101-200) 123 $728,724,299
Top Worldwide Leading Stars for Based on Comic/Graphic Novel Movies 98 $912,842,717
Top Worldwide Leading Stars for Based on Real Life Events Movies 77 $183,823,015
Top Worldwide Leading Stars for Based on TV Movies (Rank 201-300) 278 $75,984,700
Top Worldwide Leading Stars for Based on Play Movies 21 $117,473,982
Top Domestic Leading Stars for Live Action Movies (Rank 201-300) 201 $731,731,994
Top Domestic Leading Stars for Animation/Live Action Movies (Rank 101-200) 184 $325,100,054
Top International Leading Stars for Live Action Movies (Rank 301-400) 356 $547,155,505
Top International Leading Stars for Animation/Live Action Movies (Rank 201-300) 211 $420,644,926
Top Worldwide Leading Stars for Live Action Movies (Rank 201-300) 264 $1,278,887,499
Top Worldwide Leading Stars for Animation/Live Action Movies (Rank 201-300) 208 $745,744,980
Top Domestic Leading Stars for Contemporary Fiction Movies (Rank 1,201-1,300) 1,300 $47,751,449
Top Domestic Leading Stars for Science Fiction Movies (Rank 101-200) 101 $228,087,785
Top Domestic Leading Stars for Historical Fiction Movies 58 $260,834,961
Top Domestic Leading Stars for Super Hero Movies 99 $380,917,479
Top Domestic Leading Stars for Fantasy Movies (Rank 501-600) 506 $19,452,138
Top Domestic Leading Stars for Dramatization Movies 99 $119,788,236
Top International Leading Stars for Contemporary Fiction Movies (Rank 1,301-1,400) 1,344 $34,017,017
Top International Leading Stars for Science Fiction Movies (Rank 101-200) 200 $227,233,634
Top International Leading Stars for Historical Fiction Movies (Rank 301-400) 356 $69,759,025
Top International Leading Stars for Super Hero Movies 97 $531,925,238
Top International Leading Stars for Fantasy Movies (Rank 401-500) 452 $40,830,738
Top International Leading Stars for Dramatization Movies (Rank 101-200) 157 $64,034,779
Top Worldwide Leading Stars for Contemporary Fiction Movies (Rank 1,301-1,400) 1,349 $81,768,466
Top Worldwide Leading Stars for Science Fiction Movies (Rank 101-200) 148 $455,321,419
Top Worldwide Leading Stars for Historical Fiction Movies (Rank 101-200) 158 $330,593,986
Top Worldwide Leading Stars for Super Hero Movies 96 $912,842,717
Top Worldwide Leading Stars for Fantasy Movies (Rank 501-600) 502 $60,282,876
Top Worldwide Leading Stars for Dramatization Movies (Rank 101-200) 115 $183,823,015
Top Domestic Leading Stars for Adventure Movies (Rank 801-900) 809 $61,737,191
Top Domestic Leading Stars for Action Movies 99 $614,596,203
Top Domestic Leading Stars for Drama Movies 54 $338,096,022
Top Domestic Leading Stars for Thriller/Suspense Movies (Rank 301-400) 304 $42,402,632
Top International Leading Stars for Adventure Movies (Rank 801-900) 875 $66,246,092
Top International Leading Stars for Action Movies (Rank 101-200) 147 $719,959,399
Top International Leading Stars for Drama Movies (Rank 101-200) 179 $148,012,872
Top International Leading Stars for Thriller/Suspense Movies (Rank 301-400) 337 $33,582,068
Top Worldwide Leading Stars for Adventure Movies (Rank 801-900) 859 $127,983,283
Top Worldwide Leading Stars for Action Movies (Rank 101-200) 128 $1,334,555,602
Top Worldwide Leading Stars for Drama Movies 90 $486,108,894
Top Worldwide Leading Stars for Thriller/Suspense Movies (Rank 301-400) 333 $75,984,700
Top Domestic Leading Stars for PG-13 Movies (Rank 101-200) 119 $900,803,068
Top Domestic Leading Stars for R Movies (Rank 301-400) 363 $150,718,426
Top Domestic Leading Stars for PG Movies (Rank 1,501-1,600) 1,552 $5,310,554
Top International Leading Stars for PG-13 Movies (Rank 201-300) 230 $785,514,942
Top International Leading Stars for R Movies (Rank 301-400) 321 $181,850,540
Top International Leading Stars for PG Movies (Rank 1,401-1,500) 1,470 $434,949
Top Worldwide Leading Stars for PG-13 Movies (Rank 101-200) 162 $1,686,318,010
Top Worldwide Leading Stars for R Movies (Rank 301-400) 331 $332,568,966
Top Worldwide Leading Stars for PG Movies (Rank 1,601-1,700) 1,669 $5,745,503
Top Domestic Leading Stars for Walt Disney Movies (Rank 301-400) 339 $169,705,587
Top Domestic Leading Stars for Warner Bros. Movies 92 $400,369,617
Top Domestic Leading Stars for Sony Pictures Movies (Rank 301-400) 334 $67,328,130
Top Domestic Leading Stars for Paramount Pictures Movies (Rank 401-500) 418 $57,682,904
Top Domestic Leading Stars for 20th Century Fox Movies (Rank 401-500) 428 $47,713,186
Top Domestic Leading Stars for Lionsgate Movies 19 $228,087,785
Top International Leading Stars for Walt Disney Movies (Rank 501-600) 520 $43,414,417
Top International Leading Stars for Warner Bros. Movies 95 $572,755,976
Top International Leading Stars for Sony Pictures Movies (Rank 401-500) 481 $27,046,619
Top International Leading Stars for Paramount Pictures Movies (Rank 501-600) 562 $6,599,977
Top International Leading Stars for 20th Century Fox Movies (Rank 401-500) 421 $34,017,017
Top International Leading Stars for Lionsgate Movies 37 $227,233,634
Top Worldwide Leading Stars for Walt Disney Movies (Rank 401-500) 424 $213,120,004
Top Worldwide Leading Stars for Warner Bros. Movies 93 $973,125,593
Top Worldwide Leading Stars for Sony Pictures Movies (Rank 401-500) 404 $94,374,749
Top Worldwide Leading Stars for Paramount Pictures Movies (Rank 501-600) 506 $64,282,881
Top Worldwide Leading Stars for 20th Century Fox Movies (Rank 401-500) 422 $81,730,203
Top Worldwide Leading Stars for Lionsgate Movies 25 $455,321,419

All Technical Credits


Register with The Numbers for free to customize this chart.

Release
Date
TitleRoleDomestic
Box Office
International
Box Office
Worldwide
Box Office
Sep 16, 2022The Woman King Producer $67,328,130$27,046,619$94,374,749
Jan 17, 2020Troop Zero Producer
Jun 17, 2019Emanuel Executive Producer
Jul 17, 2015Lila & Eve Executive Producer $38,263$38,263
 
Averages $33,683,197$27,046,619$47,206,506
Totals 4 $67,366,393$27,046,619$94,413,012


Producer Credits


Register with The Numbers for free to customize this chart.

Release
Date
TitleOpening
Weekend
Maximum
Theaters
Domestic
Box Office
Worldwide
Box Office
Domestic
Share
Sep 16, 2022The Woman King $19,051,4423,765$67,328,130$94,374,74971.3%
Jan 17, 2020Troop Zero
 
Averages $19,051,4423,765$67,328,130$94,374,74971.3%
Totals 2 $67,328,130$94,374,749