April 12th, 2017

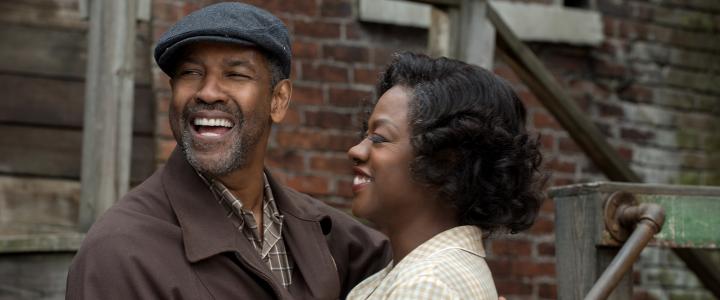
It is another shallow week on the home market. There are a number of Oscar-contenders on this week’s list, but the quality quickly drops off from that point. A couple of releases are contenders for Pick of the Week, but it is mostly filler. The best of this week’s list was Hidden Figures on Blu-ray and it is the Pick of the Week.
More...
February 26th, 2017
-1-News.jpg)
It’s Oscar night and we were live blogging the show. Read on the the highlights of what turned out to be a crazy night.
More...
February 26th, 2017

It’s Oscar night and we will be live blogging the show. Before that, let’s take a last look at the nominations with a few annotations. Nominees in italics are those that have received the most votes from our readers so far in our Oscar contest (which is open to new entries until noon, Pacific, today—enter now!). Bold films are those films I think will win. Meanwhile, those that are Underlined are those I want to win. Not all categories have underlined nominees, because not all categories have someone I’m cheering for, or because there are two nominees I couldn’t pick between.
More...
February 24th, 2017

With our annual Oscar Prediction contest underway, now is the best time to look at the nominees and try and figure out who the favorites are and which films should just feel honored to be nominated. Today we look at the final category: Best Picture. It is not a competitive category with an overwhelming favorite, a long shot with a shot, and then rest have maybe a combined 2% chance of winning.
More...
February 22nd, 2017
-2-News.jpg)
With our annual Oscar Prediction contest underway, now is the best time to look at the nominees and try and figure out who the favorites are and which films should just feel honored to be nominated. Today we look at the two Screenwriting Categories, finishing with Best Adapted Screenplay. This is a harder category to judge, because the consensus favorite, Moonlight, was considered an original screenplay by nearly everyone else.
More...
February 15th, 2017

Kedi became the first movie released in 2017 to hit the $40,000 mark on the per theater chart earning $40,103 in its lone theater. A United Kingdom was next with an average of $16,628 in four theaters. This is enough to suggest it will expand, but not enough to think it will earn a significant measure of mainstream success. The only other two films in the $10,000 club were the top two films on the overall weekend chart. The Lego Batman Movie earned an average of $12,966, putting it just ahead of Fifty Shades Darker, which earned an average of $12,563.
More...
February 15th, 2017
With our annual Oscar Prediction contest underway, now is the best time to look at the nominees and try and figure out who the favorites are and which films should just feel honored to be nominated. Today we look at Best Supporting Actor. Unlike a lot of other categories, this one could be a real race. We’ve had three previous awards ceremonies and three different winners, one of whom didn’t even get an Oscar nomination. I do have a personal favorite, but I fear my judgment is clouded as a result.
More...
February 15th, 2017
With our annual Oscar Prediction contest underway, now is the best time to look at the nominees and try and figure out who the favorites are and which films should just feel honored to be nominated. Today we look at the Supporting Roles categories, starting with Best Supporting Actress. In this category, we have one overwhelming favorite, a long shot with a shot, and then everyone else.
More...
February 12th, 2017

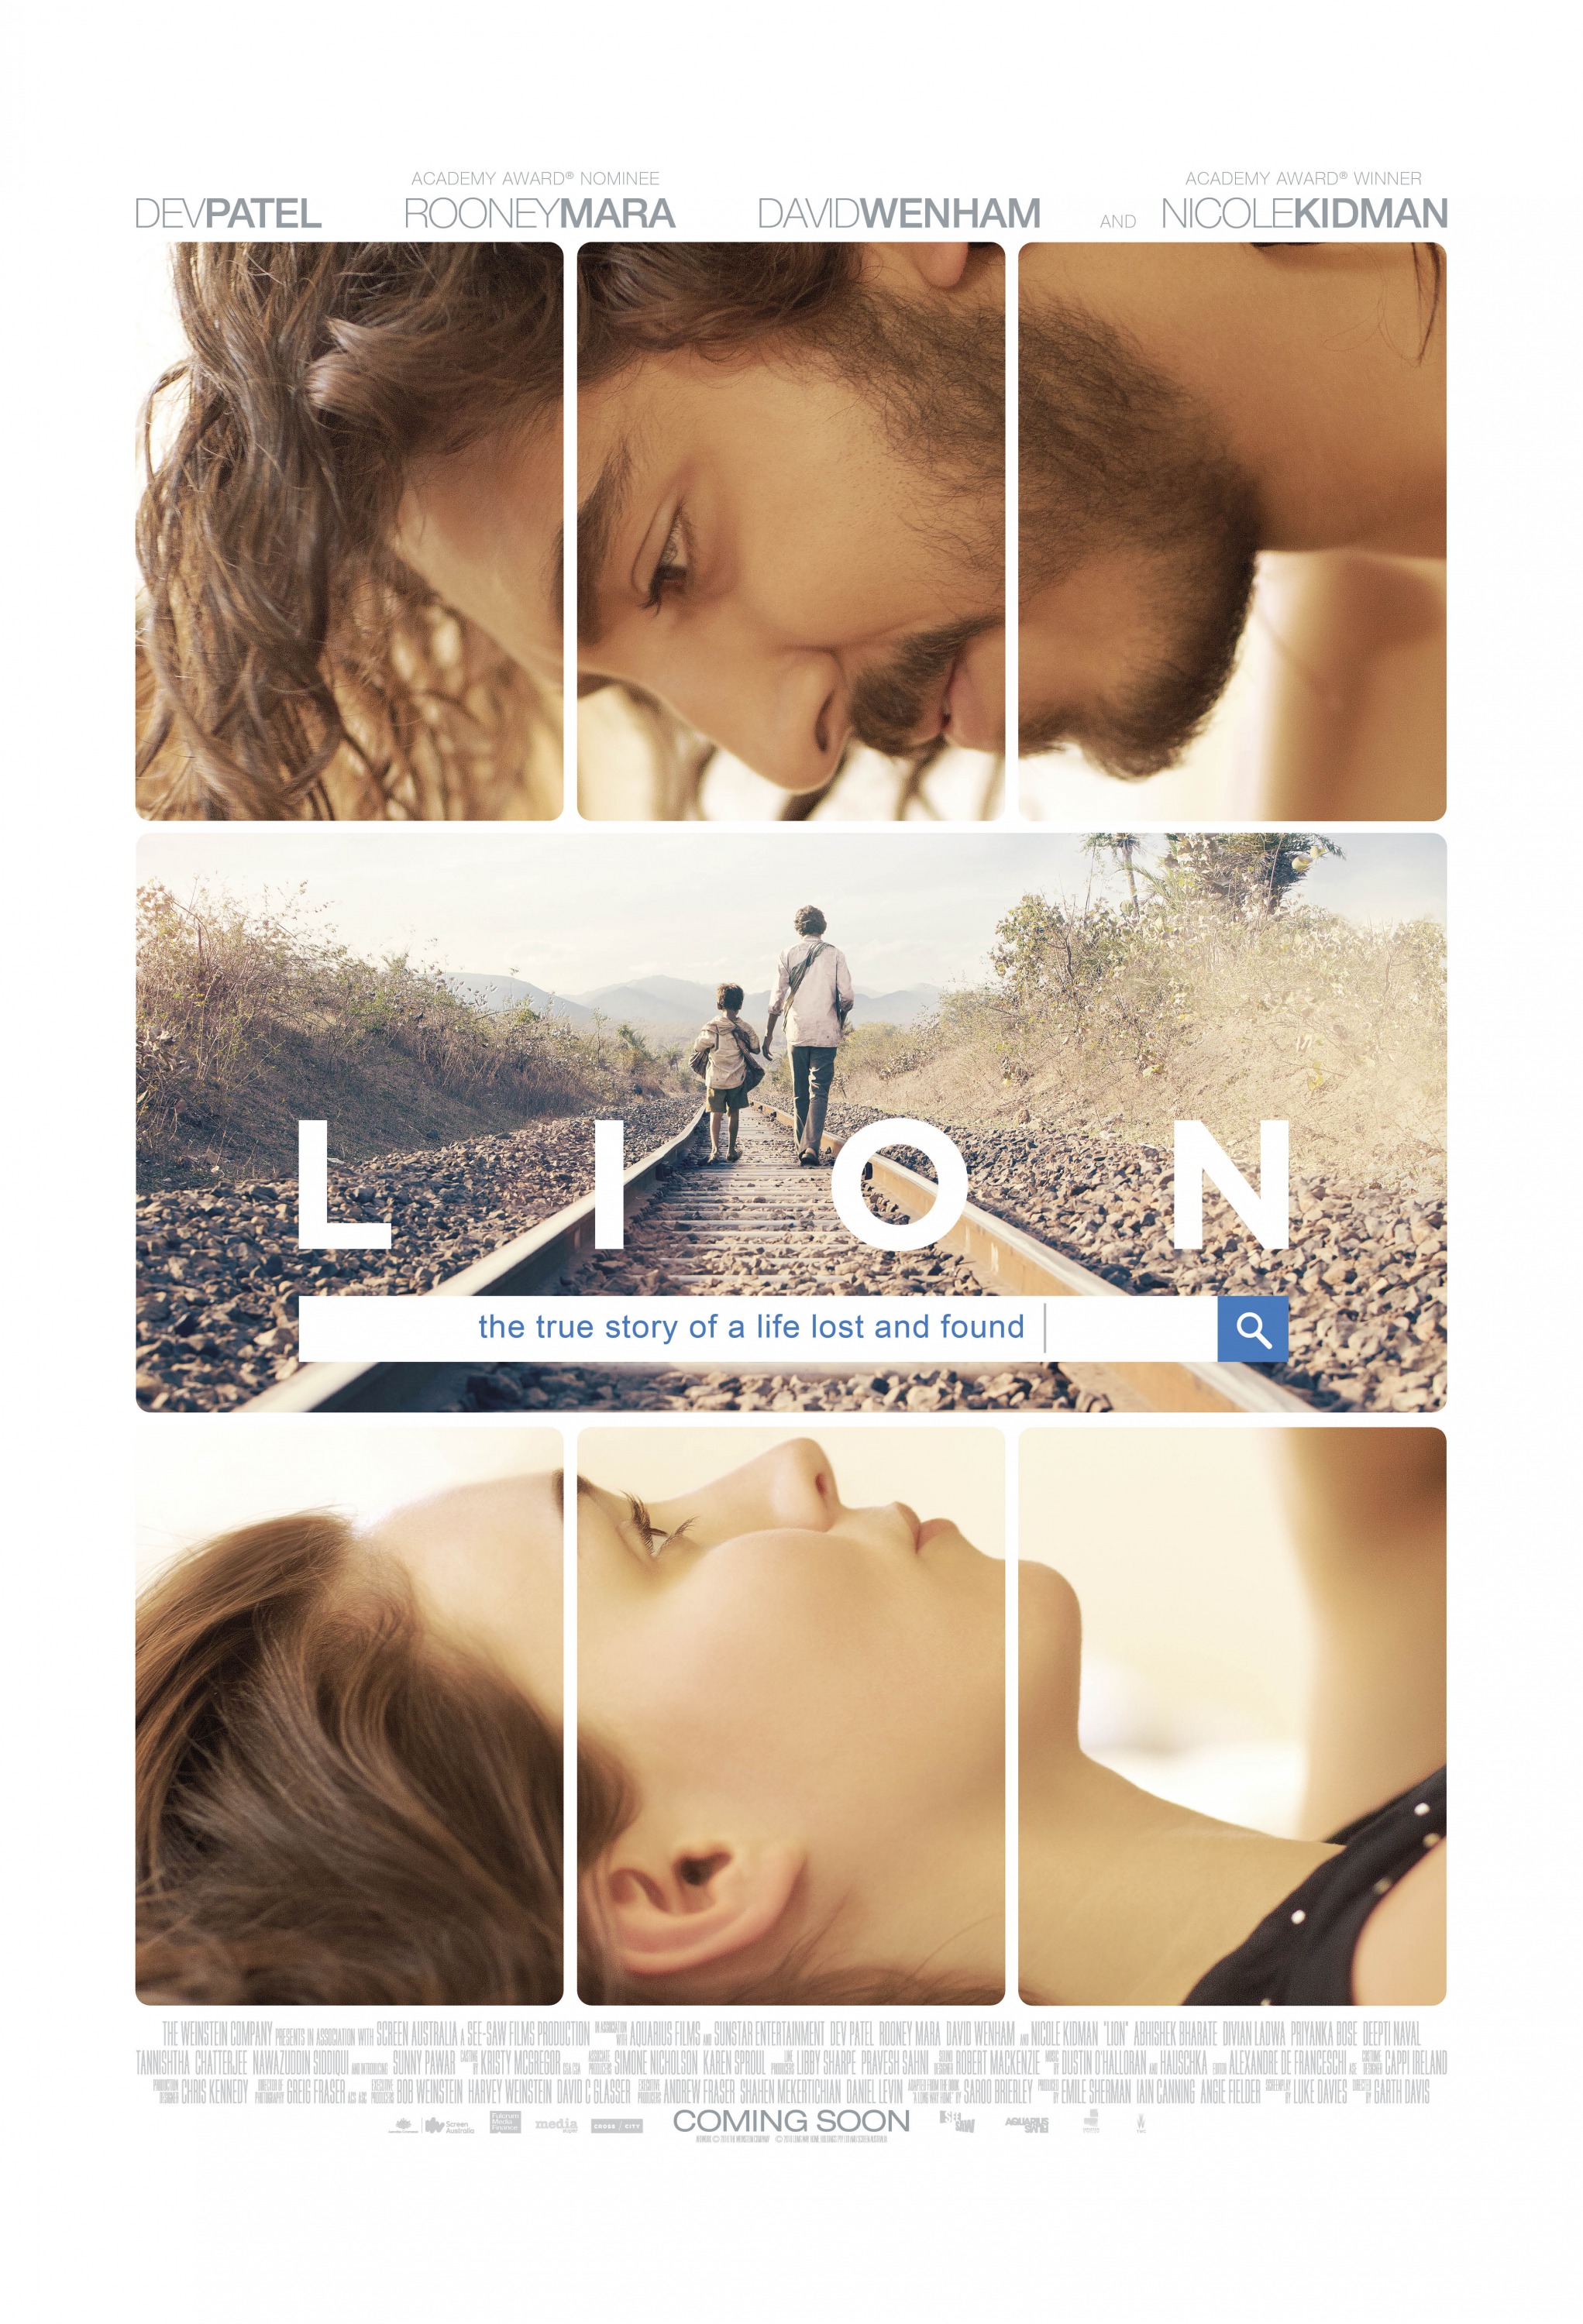
The BAFTA winners were announced on Sunday and there were very few surprises to talk about. La La Land again won the most awards with five, while only two other films, Lion and Manchester by the Sea, earned more than one award. They each won two.
More...
February 8th, 2017

It was a busy weekend on top of the theater average chart, at least for this time of year, with three films earning averages over more than $10,000. Chapter and Verse led the way with $32,713 in its lone theater. I Am Not Your Negro had an arguably better start earning an average $15,962 while playing in 43 theaters. That’s amazing for a documentary. Another documentary, Mr. Gaga, was the final film in the $10,000 club with an average of $12,677 in two theaters over the weekend and an average of $17,316 from Wednesday through Sunday. The Lure didn’t get to $10,000 over the weekend pulling in $7,370 over that time, but it earned $10,676 from Wednesday through Sunday.
More...
February 5th, 2017
-1-News.jpg)
The last of the Directors Guild of America awards were handed out over the weekend in what was likely a warm venue. On the other hand, I’m dealing with a snow storm that hasn’t really stopped in three days and power outages. Joy. Fortunately, there’s not much to talk about. All three theatrical categories went as expected with La La Land winning yet again.
More...
February 5th, 2017
-3-News.jpg)
Rings managed to win on Friday, but the weekend as a whole will belong to Split, which is expected to top the chart with $14.6 million, according to Universal’s Sunday morning projection. Rings will finish second with $13 million or so, and A Dog’s Purpose will win Sunday (making this a rare weekend where three different films will top the daily chart) to finish the weekend with $10.8 million, and $32.9 million to date.
More...
January 29th, 2017
-1-News.jpg)
An impressive decline of 34% in its second weekend and a crop of middling to poor performances by new releases will be enough to keep Split safely at the top of the box office chart this weekend. With Universal projecting $26.3 million for the weekend as of Sunday morning, Split is well ahead of the studio’s new release, A Dog’s Purpose, which will come in with around $18.4 million. Split will finish the weekend with around $78 million in total.
More...
January 25th, 2017
The overall number one film, Split, was also the only film in the $10,000 club, earning an average of $13,170. The closest competition was Tanpopo, which earned $7,677 in one theater during its 13th week of re-release.
More...
January 24th, 2017
The Oscar nominations were announced starting at 5:18 am Pacific time. Nothing is good that early in the morning. Worse still, it’s a boring year for nominations with very few surprises worth talking about, especially in the biggest categories. Leading the way was La La Land with 14 nominations, tying the record.
More...
January 18th, 2017
-1-News.jpg)
Despite earning 50% positive reviews, Worlds Apart topped the theater average chart with $16,353 in its one theater. The only other film in the $10,000 club was 20th Century Women, which spent its third week there with an average of $10,894 in 29 theaters.
More...
January 12th, 2017
The last of the Directors Guild of America nominations were announced and the Oscars are really shaping up to be a one-movie show. That movie is Deadpool. I’m joking of course, but it did get yet another nomination. At this point, it could earn a Best Picture Oscar nomination and I wouldn’t be surprised. The film that is dominating Awards Season is La La Land and frankly I’ve lost count of the number of nominations it has received.
More...
January 11th, 2017

The Producers Guild of America finally finished announcing their nominations. (They spread out their announcements for reasons I’ve never quite understood.) Most of the films on this list have already earned more than a few previous nominations. We appear to be settling into a predictable Awards Season.
More...
January 11th, 2017
The BAFTA nominations were announced and it should come as no surprise what film lead the way... La La Land with 11 nominations, Nocturnal Animals and Arrival are tied for second with nine nominations a piece.
More...
January 10th, 2017

The theater average chart was dominated by holdovers, as is the norm this time of year. The top film was Patriots Day with an average of $14,972 in seven theaters. This bodes very well for its wide expansion next weekend. 20th Century Women is becoming a sleeper hit earning an average of $13,047 in ten theaters. This is one of those films that should be earning more Awards Season buzz, but I fear it has slipped between the cracks. Toni Erdmann and Paterson were neck-and-neck with averages of $10,472 and $10,205 respectively.
More...
January 4th, 2017
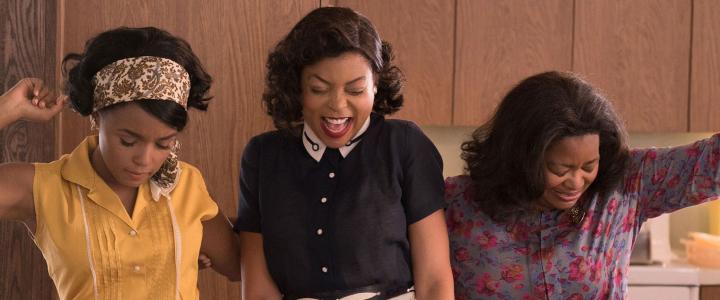
Hidden Figures rose to first place during its first full weekend of release with an average of $34,329 in 25 theaters. It already has more than $2 million and it expands wide on Friday. 20th Century Women was next with an average of $27,800 in four theaters. It isn’t a major player during Awards Season, but it is picking up enough nominations to help it stick around in theaters. Patriots Day was down just 8% earning an average of $21,117 in seven theaters. Last week’s winner, Silence, fell to an average of $20,827 in four theaters. If it has a similar drop next week, it will put its wide release in jeopardy. The best limited release of the week was Paterson, which earned an average of $17,334 in four theaters. Toni Erdmann earned an average of $14,000 in three theaters during its first full week of release. La La Land continues to expand, but remained in the $10,000 club with an average of $12,738. The overall number one film, Rogue One: A Star Wars Story, was next with an average of $11,934, while the second place film, Sing, was right behind with an average of $10,647.
More...
December 28th, 2016
-2-News.jpg)
Silence scored first place on the theater average chart earning an average of $32,720 in four theaters. Patriots Day was next with an average of $23,044 in seven theaters. Most impressively, Hidden Figures earned an average of $20,620 in 25 theaters, in just one day. The final film in the $10,000 club was the overall number one film, Rogue One: A Star Wars Story with an average of $15,404.
More...
December 14th, 2016

The Screen Actors Guild were the third group to announce their nominations for this awards season. So far there have been three different films earning the most nominations. This could mean the Oscar race will be a lot closer than in past years. This time around Manchester by the Sea led the way with four nominations.
More...
December 13th, 2016

La La Land dominated the per theater chart with an average of $176,221 in five theaters. This is not only the best of the year, it is the second best ever for a live-action film, behind just The Grand Budapest Hotel average of $202,792 in four theaters. Jackie was well back with an average of $18,933 in 26 theaters. Had La La Land not come out this weekend, this would have been big news. Now it might get lost in the crowd. Lion remained in the $10,000 club for the third weekend in a row with an average of $11,224 in 15 theaters.
More...
December 12th, 2016
The Golden Globes nominations were announced and we are starting to see a few names pop up over and over again. La La Land led the way with seven nominations, but Moonlight was right behind with six and Manchester by the Sea earned five. You will be hearing those three names over and over and over again this Awards Season.
More...
December 11th, 2016

Moana will get to enjoy one last weekend at the top of the box office chart, in spite of a good debut for Office Christmas Party. Disney’s animated adventure will post about $18.8 million in its third weekend, for $145 million to date. It’s beginning to lag behind the performance of Frozen, which made $22.6 million in its third weekend in wide release, and had amassed $164.8 million. That still puts Moana well on course for $300 million domestically, although $350 million is looking like a stretch. Internationally, Moana will earn around $23.5 million this weekend, taking its total overseas to $93.8 million, and its global haul to $238.8 million.
More...
December 6th, 2016
-2-News.jpg)
Jackie led the way on the theater average chart with an average of $55,743 in five theaters. Given this start and add in its Oscar buzz and the film has a real shot at expanding wide. Last week’s winner, Lion, fell to second place with an average of $16,651 in seven theaters. Manchester by the Sea continues its impressive run with an average of $14,592 in 156 theaters. It still has room to grow. Miss Sloane earned an average of $11,213 in four theaters. It is reportedly expanding wide this weekend, but that can mean anything from a few hundred theaters to well over 2,000. Finally, Things to Come opened with an average of $11,030 in three theaters.
More...
December 4th, 2016

The top of the box office chart remains a tale of two movies this weekend, with Moana maintaining an impressive lead over Fantastic Beasts and Where to Find Them, but both movies doing very nicely heading into the Christmas season. Moana tops the chart again this weekend with $28.4 million, for a total of $119.9 million at the end of the weekend. By way of comparison, Frozen had earned $134.3 million at this point in its run, but fell a slightly larger 53% from Thanksgiving, compared to Moana’s 50% decline. The next few weeks should be very lucrative for the animated adventure, which is likely to sail past $300 million at the domestic box office.
More...
November 29th, 2016
Lion led the way on the theater average chart this week with an average of $30,840 in four theaters. Its reviews are great and it could become a sleeper hit throughout the Christmas holidays. Up next was Manchester by the Sea with an average of $25,541 in 48 theaters. It still has plenty of room to expand and its Awards Season buzz is growing. Miss Sloane opened with an average of $19,932 in three theaters. This is good, but not good enough to think it will expand truly wide. The overall number one film, Moana, was next with an average of $14,615. The final film in the $10,000 club was Fantastic Beasts and Where to Find Them with an average of $10,880.
More...
November 27th, 2016

Disney’s domination of Thanksgiving weekend will continue in 2016, with Moana expected to post $55.5 million for the three-day weekend and $81.1 million in total, making it either the second-best or best Thanksgiving opener of all time, depending on what you consider an “opener.” Disney is claiming second place for Moana behind Frozen, which had a $67.4 million 3-day weekend, and $93.6 million 5-day weekend back in 2013. That film had already opened in a single theater the weekend before, so if we want to split hairs, it technically wasn’t opening that weekend. Either way you look at it, it’s a great start for Moana, and another handsome win for Disney. The studio can now claim the top six 5-day Thanksgiving debuts and and the top eight 3-day Thanksgiving openings of all time.
More...
November 25th, 2016
While Thanksgiving weekend is a boon for wide releases, the number of potential monster hits in theaters scares away a lot of the limited releases. There are some great releases, like Always Shine and Baden Baden, as well as some bigger releases, like Lion and Miss Sloane. Hopefully they will find audiences in limited release.
More...