Jodie Foster

Jodie Foster
By Franz Richter (User:FRZ) (own work (taken with Canon PowerShot A640)) [CC BY-SA 2.5], via Wikimedia Commons
Best known as a Leading Actress based on credits in that role in 24 films, with $1,742,302,881 worldwide aggregate box office (rank #143)
Best-known acting roles: Delacourt (Elysium), Madeliene White (Inside Man), Kyle Sherin (Flightplan), Meg Altman (Panic Room), Ellie Arroway (Contact)
Best-known technical roles: Money Monster (Director), The Brave One (Executive Producer), Nell (Producer), Little Man Tate (Director), Home for the Holidays (Director)
Most productive collaborators: Matt Damon, Neill Blomkamp, George Clooney, Sharlto Copley, Bill Block
Born: November 19, 1962 (61 years old)
                                    

  1. Summary
  2. News
  3. Acting Credits
  4. Technical Credits

Career Summary


  MoviesDomestic
Box Office
International
Box Office
Worldwide
Box Office
As an ActorLeading24$915,611,075$826,691,806$1,742,302,881
Supporting10$159,570,379$267,483,985$427,054,364
Lead Ensemble Member1$6,708,137$6,608,490$13,316,627
Narrator1$115,705$77,578$193,283
Inverviewee1$50,168$12,732$62,900
In Technical RolesDirector4$83,470,751$57,104,402$140,575,153
Executive Producer2$36,909,509$33,076,478$69,985,987
Producer2$51,061,587$4,650,382$55,711,969

Career Trend

This graph shows Jodie Foster’s score on our annual analysis of leading stars at the box office. The Star Score represents points assigned to each of the leading stars of the top 100 movies (based on box office) in the current year and two preceding years. For appearing in the number one movie in a year a star gets 100 points, the number two movie 99 points and so on..

Latest Ranking on Selected Box Office Record Lists


The Mauritanian trailer

February 2nd, 2021

Real-life drama starring Tahar Rahim, Jodie Foster, Shailene Woodley, and Benedict Cumberbatch opens in theaters on February 19 ... Full Movie Details.

Captured by the U.S. Government, Mohamedou Ould Slahi languishes in prison for years without charge or trial. Losing all hope, Slahi finds allies in defense attorney Nancy Hollander and her associate Teri Duncan. Together they face countless obstacles in a desperate pursuit for justice. Their controversial advocacy, along with evidence uncovered by formidable military prosecutor, Lt. Colonel Stuart Couch, eventually reveals a shocking and far reaching conspiracy. More...

2018 Preview: June

June 1st, 2018

Incredibles 2

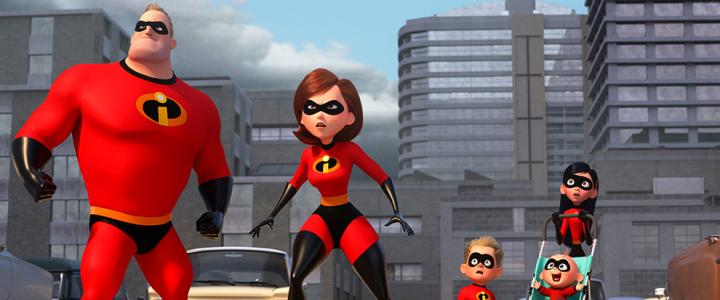
This May was an odd month, as Avengers: Infinity War opened on the last weekend of April, rather than the first weekend of May. This meant May started out slowly, but Deadpool 2 and Solo: A Star Wars Story did well enough to give 2018 a healthy lead over 2017. Looking forward, there are two potential monster hits this month, Incredibles 2 and Jurassic World: Fallen Kingdom, and another $100 million hit, Ocean’s 8. Last June, there were four $100 million hits, led by Wonder Woman, which pulled in over $400 million. I think 2018 and 2017 will be an even match at the top, so 2018 will have to rely on depth to improve upon its lead over 2017. More...

Hotel Artemis Trailer

May 30th, 2018

Thriller starring Jodie Foster opens June 8 ... Full Movie Details. More...

Home Market Releases for September 6th, 2016

September 6th, 2016

The Iron Giant

It is a big week with a ton of home market releases, including several that were contenders for Pick of the Week. There were two limited releases in that group, Love and Friendship and Tale of Tales. Love and Friendship got better reviews, but Tale of TalesBlu-ray is more interesting in my mind. Star Trek 50th Anniversary TV and Movie Collection is a great Blu-ray box set and would make an amazing gift. As for the Pick of the Week, that was an easy choice: The Iron Giant: Signature Edition on Blu-ray. Although if you are a hardcore fan, then the Ultimate Collector’s Edition might be worth the $75. More...

2016 Preview: May

May 1st, 2016

Captain America: Civil War

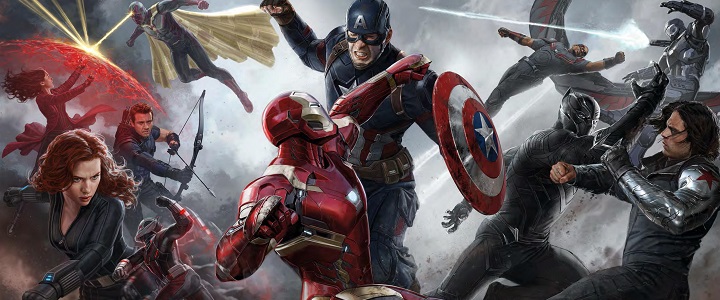
April started on a soft note and ended weak, but thanks to The Jungle Book, overall the month was actually really good. That's what happens when you get a surprise $300 million hit. This bodes well for May, which is both a slow month and a fantastic month. There are only four weekends and only eight movies coming out, but of those eight films, five have a shot at $100 million. The potential blockbusters are led by Captain America: Civil War, which is not only going to be the biggest hit of the month, but according to a Fandango survey, it is the most anticipated film of the summer. (On a side note, Finding Dory is the most anticipated family film of the summer and Ghostbusters is the most anticipated comedy of the summer. I was surprised by the last result.) Both Alice Through the Looking Glass and X-Men: Apocalypse have real shots at $200 million. One of them could get to $300 million, if they weren't opening against each other. Overall, the month looks excellent. Even better, last May there was only one monster hit, The Avengers: Age of Ultron, and most analysts think Captain America: Civil War will beat it at the box office. (There's also the issue of the misalignment in the weekends, which hurt April, but will really help May.) More...

2013 Preview: August

August 1st, 2013

July was hit and miss at the box office, mostly miss. In fact, only two films really topped expectations, Despicable Me 2 and The Conjuring. That said, 2013 has nearly closed the gap with 2012 and it won't take much to pull ahead. Looking forward to August, we find that it is a very busy month with 16 or so films opening wide over five weeks. Of course, the closer you get to September, the more likely these films will struggle to find an audience, and more often than not, there are simply too many films opening wide to suspect they will all find an audience. On the high end, 2 Guns could be the biggest hit of the month with just over $100 million. The Smurfs 2 and Elysium could pull in $100 million. All three of those films are opening in the first two weeks of the month. After that, most of the new releases will be lucky if they reach $50 million during their theatrical runs. By comparison, last August was not as busy with 14 wide releases. Of those, only one film, The Bourne Legacy, topped $100 million, although a couple came reasonably close. Hopefully we will have more $100 million hits this time around and 2013 will be able to complete the comeback. More...

All Acting Credits


Register with The Numbers for free to customize this chart.

Release
Date
TitleRoleDomestic
Box Office
International
Box Office
Worldwide
Box Office
Oct 20, 2023Nyad Bonnie Stoll $16,098$16,098
Aug 31, 2021Bugsy Malone Talulah $47,158$47,158
Feb 12, 2021The Mauritanian Nancy Hollander $836,536$6,526,082$7,362,618
Aug 2, 2019Love, Antosha Herself $50,168$12,732$62,900
Apr 19, 2019Be Natural: The Untold… Narrator $115,705$77,578$193,283
Jun 8, 2018Hotel Artemis The Nurse $6,708,137$6,608,490$13,316,627
Aug 9, 2013Elysium Delacourt $93,050,117$193,141,974$286,192,091
UnknownSugar Kings
Dec 16, 2011Carnage Penelope Longstreet $2,546,747$35,565,407$38,112,154
May 6, 2011The Beaver Meredith Black $970,816$4,075,222$5,046,038
Apr 4, 2008Nim's Island Alexandra Rover $48,006,762$53,850,663$101,857,425
Sep 14, 2007The Brave One Erica Bain $36,793,804$32,998,900$69,792,704
Mar 24, 2006Inside Man Madeliene White $88,634,237$97,164,028$185,798,265
Oct 4, 2005The Little Girl Who Li… Rynn
Sep 23, 2005Flightplan Kyle Sherin $89,706,988$124,685,916$214,392,904
Nov 26, 2004Un long dimanche de fi… Elodie Gordes $6,167,817$63,554,627$69,722,444
Jun 14, 2002The Dangerous Lives of… Sister Assumpta $1,779,284$1,779,284
Mar 29, 2002Panic Room Meg Altman $95,308,367$101,000,000$196,308,367
Dec 17, 1999Anna and the King Anna Leonowens $39,251,128$39,251,128
Jul 11, 1997Contact Ellie Arroway $100,920,329$64,979,671$165,900,000
Dec 14, 1994Nell Nell $33,592,700$33,592,700
May 20, 1994Maverick Annabelle Bransford $101,631,272$81,383,965$183,015,237
Feb 5, 1993Sommersby Laurel $50,081,992$90,000,000$140,081,992
Mar 20, 1992Shadows and Fog Prostitute $2,735,731$2,735,731
Oct 9, 1991Little Man Tate Dede Tate $24,989,789$24,989,789
Feb 14, 1991The Silence of the Lambs Clarice Starling $130,726,716$145,000,000$275,726,716
Oct 14, 1988The Accused Sarah Tobias $32,078,318$32,078,318
Aug 26, 1988Stealing Home Katie Chandler $7,467,504$7,467,504
Jan 22, 1988Five Corners Linda $969,000$969,000
1987Siesta Nancy $700,000$700,000
Mar 9, 1984The Hotel New Hampshire Frannie $5,142,858$5,142,858
Jan 1, 1984O'Hara's Wife Barbara O'Hara
May 23, 1980Carny Donna $1,817,720$1,817,720
Feb 29, 1980Foxes Jeanie $7,470,348$7,470,348
Jan 21, 1977Freaky Friday Annabel Andrews $25,942,000$25,942,000
Feb 8, 1976Taxi Driver Iris $28,262,574$186,080$28,448,654
Jan 29, 1975Alice Doesn't Live Her… Audrey $17,600,000$17,600,000
 
Averages $33,814,233$55,043,730$64,203,825
Totals 37 $1,082,055,464$1,100,874,591$2,182,930,055


Leading or Lead Ensemble Roles


Register with The Numbers for free to customize this chart.

Release
Date
TitleOpening
Weekend
Maximum
Theaters
Domestic
Box Office
Worldwide
Box Office
Domestic
Share
Oct 20, 2023Nyad $16,098
Aug 31, 2021Bugsy Malone $47,158
Jun 8, 2018Hotel Artemis $3,232,7902,407$6,708,137$13,316,62750.4%
UnknownSugar Kings
Dec 16, 2011Carnage $79,795494$2,546,747$38,112,1546.7%
Apr 4, 2008Nim's Island $13,210,5793,518$48,006,762$101,857,42547.1%
Sep 14, 2007The Brave One $13,471,4882,837$36,793,804$69,792,70452.7%
Mar 24, 2006Inside Man $28,954,9452,867$88,634,237$185,798,26547.7%
Oct 4, 2005The Little Girl Who Li…
Sep 23, 2005Flightplan $24,629,9383,424$89,706,988$214,392,90441.8%
Mar 29, 2002Panic Room $30,056,7513,119$95,308,367$196,308,36748.6%
Dec 17, 1999Anna and the King $5,223,4162,140$39,251,128$39,251,128100.0%
Jul 11, 1997Contact $20,584,9082,314$100,920,329$165,900,00060.8%
Dec 14, 1994Nell $62,6631,236$33,592,700$33,592,700100.0%
May 20, 1994Maverick $17,248,5452,537$101,631,272$183,015,23755.5%
Feb 5, 1993Sommersby $8,104,6241,762$50,081,992$140,081,99235.8%
Oct 9, 1991Little Man Tate 1,012$24,989,789$24,989,789100.0%
Feb 14, 1991The Silence of the Lambs $13,766,8141,642$130,726,716$275,726,71647.4%
Oct 14, 1988The Accused $4,316,369930$32,078,318$32,078,318100.0%
Jan 22, 1988Five Corners $78,60212$969,000$969,000100.0%
Mar 9, 1984The Hotel New Hampshire $1,075,800262$5,142,858$5,142,858100.0%
Jan 1, 1984O'Hara's Wife
May 23, 1980Carny $1,817,720$1,817,720100.0%
Feb 29, 1980Foxes $221,14134$7,470,348$7,470,348100.0%
Jan 21, 1977Freaky Friday $25,942,000$25,942,000100.0%
 
Averages $10,842,3041,808$46,115,961$79,800,88769.7%
Totals 25 $922,319,212$1,755,619,508


Supporting Roles


Register with The Numbers for free to customize this chart.

Release
Date
TitleOpening
Weekend
Maximum
Theaters
Domestic
Box Office
Worldwide
Box Office
Domestic
Share
Feb 12, 2021The Mauritanian $163,789287$836,536$7,362,61811.4%
Aug 9, 2013Elysium $29,807,3933,284$93,050,117$286,192,09132.5%
May 6, 2011The Beaver $107,577168$970,816$5,046,03819.2%
Nov 26, 2004Un long dimanche de fi… $101,749219$6,167,817$69,722,4448.8%
Jun 14, 2002The Dangerous Lives of… $55,000125$1,779,284$1,779,284100.0%
Mar 20, 1992Shadows and Fog $2,735,731$2,735,731100.0%
Aug 26, 1988Stealing Home $2,346,864984$7,467,504$7,467,504100.0%
1987Siesta $700,000$700,000100.0%
Feb 8, 1976Taxi Driver 15$28,262,574$28,448,65499.3%
Jan 29, 1975Alice Doesn't Live Her… $17,600,000$17,600,000100.0%
 
Averages $5,430,395726$15,957,038$42,705,43667.1%
Totals 10 $159,570,379$427,054,364

Latest Ranking on All Acting Box Office Record Lists


RecordRankAmount
Top 100 Stars in Leading Roles at the Domestic Box Office (Rank 201-300) 235 $922,319,212
Top 100 Stars in Supporting Roles at the Domestic Box Office (Rank 11,001-11,100) 11,073 $159,570,379
Top Live Action Stars at the Domestic Box Office (Rank 701-800) 793 $1,082,055,464
Top Above the Line Stars at the Domestic Box Office (Rank 1,001-1,100) 1,004 $531,573,560
Top Below the Line Stars at the Domestic Box Office (Rank 57,601-57,700) 57,657 $165,873
Top Stars at the Domestic Box Office (Rank 1,001-1,100) 1,020 $1,082,055,464
Top 100 Stars in Leading Roles at the International Box Office (Rank 301-400) 380 $833,300,296
Top 100 Stars in Supporting Roles at the International Box Office (Rank 8,201-8,300) 8,243 $267,483,985
Top Live Action Stars at the International Box Office (Rank 1,101-1,200) 1,152 $1,100,874,591
Top Above the Line Stars at the International Box Office (Rank 1,001-1,100) 1,009 $699,679,938
Top Below the Line Stars at the International Box Office (Rank 52,701-52,800) 52,781 $90,310
Top Stars at the International Box Office (Rank 1,401-1,500) 1,495 $1,100,874,591
Top 100 Stars in Leading Roles at the Worldwide Box Office (Rank 301-400) 307 $1,755,619,508
Top 100 Stars in Supporting Roles at the Worldwide Box Office (Rank 9,101-9,200) 9,124 $427,054,364
Top Live Action Stars at the Worldwide Box Office (Rank 901-1,000) 975 $2,182,930,055
Top Above the Line Stars at the Wordwide Box Office (Rank 901-1,000) 987 $1,231,253,498
Top Below the Line Stars at the Worldwide Box Office (Rank 59,601-59,700) 59,611 $256,183
Top Stars at the Worldwide Box Office (Rank 1,201-1,300) 1,273 $2,182,930,055
Highest Grossing Stars of 1988 at the Domestic Box Office (Rank 101-200) 135 66
Highest Grossing Stars of 1989 at the Domestic Box Office (Rank 101-200) 138 66
Highest Grossing Stars of 1990 at the Domestic Box Office (Rank 101-200) 143 66
Highest Grossing Stars of 1991 at the Domestic Box Office 42 146
Highest Grossing Stars of 1992 at the Domestic Box Office 43 146
Highest Grossing Stars of 1993 at the Domestic Box Office 18 221
Highest Grossing Stars of 1994 at the Domestic Box Office 22 224
Highest Grossing Stars of 1995 at the Domestic Box Office 17 224
Highest Grossing Stars of 1996 at the Domestic Box Office 47 149
Highest Grossing Stars of 1997 at the Domestic Box Office 99 86
Highest Grossing Stars of 1998 at the Domestic Box Office (Rank 101-200) 105 86
Highest Grossing Stars of 1999 at the Domestic Box Office 59 135
Highest Grossing Stars of 2000 at the Domestic Box Office (Rank 201-300) 245 49
Highest Grossing Stars of 2001 at the Domestic Box Office (Rank 201-300) 252 49
Highest Grossing Stars of 2002 at the Domestic Box Office (Rank 101-200) 161 76
Highest Grossing Stars of 2003 at the Domestic Box Office (Rank 101-200) 181 76
Highest Grossing Stars of 2004 at the Domestic Box Office (Rank 101-200) 180 76
Highest Grossing Stars of 2005 at the Domestic Box Office (Rank 101-200) 155 81
Highest Grossing Stars of 2006 at the Domestic Box Office 36 160
Highest Grossing Stars of 2007 at the Domestic Box Office 23 189
Highest Grossing Stars of 2008 at the Domestic Box Office 41 149
Highest Grossing Stars of 2009 at the Domestic Box Office (Rank 101-200) 196 70
Highest Grossing Stars of 2010 at the Domestic Box Office (Rank 301-400) 314 41
Highest Grossing Stars of 2002 at the International Box Office (Rank 101-200) 148 79
Highest Grossing Stars of 2003 at the International Box Office (Rank 101-200) 155 79
Highest Grossing Stars of 2004 at the International Box Office (Rank 101-200) 150 79
Highest Grossing Stars of 2005 at the International Box Office (Rank 101-200) 131 82
Highest Grossing Stars of 2006 at the International Box Office 42 155
Highest Grossing Stars of 2007 at the International Box Office 28 161
Highest Grossing Stars of 2008 at the International Box Office 52 117
Highest Grossing Stars of 2009 at the International Box Office (Rank 201-300) 278 44
Highest Grossing Stars of 2010 at the International Box Office (Rank 301-400) 302 38
Highest Grossing Stars of 2000 at the Worldwide Box Office (Rank 201-300) 289 33
Highest Grossing Stars of 2001 at the Worldwide Box Office (Rank 201-300) 294 33
Highest Grossing Stars of 2002 at the Worldwide Box Office (Rank 101-200) 157 79
Highest Grossing Stars of 2003 at the Worldwide Box Office (Rank 101-200) 166 79
Highest Grossing Stars of 2004 at the Worldwide Box Office (Rank 101-200) 158 79
Highest Grossing Stars of 2005 at the Worldwide Box Office (Rank 101-200) 146 83
Highest Grossing Stars of 2006 at the Worldwide Box Office 35 163
Highest Grossing Stars of 2007 at the Worldwide Box Office 25 183
Highest Grossing Stars of 2008 at the Worldwide Box Office 49 137
Highest Grossing Stars of 2009 at the Worldwide Box Office (Rank 201-300) 243 57
Highest Grossing Stars of 2010 at the Worldwide Box Office (Rank 301-400) 310 37
Top Domestic Leading Stars for Original Screenplay Movies (Rank 201-300) 270 $384,476,708
Top Domestic Leading Stars for Based on Fiction Book/Short Story Movies 100 $349,989,793
Top Domestic Leading Stars for Based on TV Movies (Rank 101-200) 129 $101,631,272
Top Domestic Leading Stars for Remake Movies (Rank 101-200) 168 $50,081,992
Top Domestic Leading Stars for Based on Play Movies 80 $36,139,447
Top International Leading Stars for Original Screenplay Movies (Rank 301-400) 370 $362,504,492
Top International Leading Stars for Based on Fiction Book/Short Story Movies (Rank 201-300) 210 $263,830,334
Top International Leading Stars for Based on TV Movies (Rank 201-300) 201 $81,383,965
Top International Leading Stars for Remake Movies (Rank 101-200) 101 $90,000,000
Top International Leading Stars for Based on Factual Book/Article Movies (Rank 401-500) 422 $16,098
Top International Leading Stars for Based on Play Movies 35 $35,565,407
Top Worldwide Leading Stars for Original Screenplay Movies (Rank 301-400) 305 $746,981,200
Top Worldwide Leading Stars for Based on Fiction Book/Short Story Movies (Rank 101-200) 145 $613,820,127
Top Worldwide Leading Stars for Based on TV Movies (Rank 101-200) 168 $183,015,237
Top Worldwide Leading Stars for Remake Movies (Rank 101-200) 121 $140,081,992
Top Worldwide Leading Stars for Based on Factual Book/Article Movies (Rank 401-500) 494 $16,098
Top Worldwide Leading Stars for Based on Play Movies 40 $71,704,854
Top Domestic Leading Stars for Live Action Movies (Rank 101-200) 134 $922,319,212
Top International Leading Stars for Live Action Movies (Rank 201-300) 211 $833,300,296
Top Worldwide Leading Stars for Live Action Movies (Rank 101-200) 168 $1,755,619,508
Top Domestic Leading Stars for Contemporary Fiction Movies (Rank 101-200) 158 $544,634,734
Top Domestic Leading Stars for Science Fiction Movies (Rank 201-300) 245 $107,628,466
Top Domestic Leading Stars for Historical Fiction Movies (Rank 101-200) 129 $156,856,122
Top Domestic Leading Stars for Fantasy Movies (Rank 201-300) 242 $73,948,762
Top Domestic Leading Stars for Dramatization Movies (Rank 201-300) 289 $39,251,128
Top International Leading Stars for Contemporary Fiction Movies (Rank 101-200) 179 $536,414,251
Top International Leading Stars for Science Fiction Movies (Rank 301-400) 369 $71,588,161
Top International Leading Stars for Historical Fiction Movies (Rank 101-200) 173 $171,431,123
Top International Leading Stars for Fantasy Movies (Rank 301-400) 374 $53,850,663
Top International Leading Stars for Dramatization Movies (Rank 1,201-1,300) 1,236 $16,098
Top Worldwide Leading Stars for Contemporary Fiction Movies (Rank 101-200) 148 $1,081,048,985
Top Worldwide Leading Stars for Science Fiction Movies (Rank 301-400) 321 $179,216,627
Top Worldwide Leading Stars for Historical Fiction Movies (Rank 101-200) 159 $328,287,245
Top Worldwide Leading Stars for Fantasy Movies (Rank 301-400) 312 $127,799,425
Top Worldwide Leading Stars for Dramatization Movies (Rank 301-400) 387 $39,267,226
Top Domestic Leading Stars for Adventure Movies (Rank 801-900) 883 $48,006,762
Top Domestic Leading Stars for Comedy Movies (Rank 901-1,000) 951 $25,942,000
Top Domestic Leading Stars for Drama Movies 62 $296,314,182
Top Domestic Leading Stars for Thriller/Suspense Movies 25 $317,151,533
Top Domestic Leading Stars for Horror Movies 38 $130,726,716
Top Domestic Leading Stars for Black Comedy Movies (Rank 301-400) 346 $2,546,747
Top Domestic Leading Stars for Western Movies 21 $101,631,272
Top International Leading Stars for Adventure Movies (Rank 901-1,000) 930 $53,850,663
Top International Leading Stars for Drama Movies (Rank 101-200) 166 $154,995,769
Top International Leading Stars for Thriller/Suspense Movies 32 $362,457,334
Top International Leading Stars for Horror Movies 40 $145,000,000
Top International Leading Stars for Musical Movies (Rank 201-300) 284 $47,158
Top International Leading Stars for Black Comedy Movies 94 $35,565,407
Top International Leading Stars for Western Movies 34 $81,383,965
Top Worldwide Leading Stars for Adventure Movies (Rank 901-1,000) 922 $101,857,425
Top Worldwide Leading Stars for Comedy Movies (Rank 1,101-1,200) 1,159 $25,942,000
Top Worldwide Leading Stars for Drama Movies 96 $451,309,951
Top Worldwide Leading Stars for Thriller/Suspense Movies 27 $679,608,867
Top Worldwide Leading Stars for Horror Movies 41 $275,726,716
Top Worldwide Leading Stars for Musical Movies (Rank 401-500) 411 $47,158
Top Worldwide Leading Stars for Black Comedy Movies (Rank 101-200) 191 $38,112,154
Top Worldwide Leading Stars for Western Movies 24 $183,015,237
Top Domestic Leading Stars for PG-13 Movies (Rank 401-500) 481 $212,632,808
Top Domestic Leading Stars for R Movies (Rank 101-200) 107 $392,796,326
Top Domestic Leading Stars for PG Movies (Rank 201-300) 226 $275,548,152
Top International Leading Stars for PG-13 Movies (Rank 501-600) 571 $214,702,014
Top International Leading Stars for R Movies (Rank 101-200) 131 $418,336,825
Top International Leading Stars for PG Movies (Rank 401-500) 412 $200,214,299
Top Worldwide Leading Stars for PG-13 Movies (Rank 501-600) 541 $427,334,822
Top Worldwide Leading Stars for R Movies (Rank 101-200) 117 $811,133,151
Top Worldwide Leading Stars for PG Movies (Rank 301-400) 323 $475,762,451
Top Domestic Leading Stars for Walt Disney Movies (Rank 401-500) 406 $115,648,988
Top Domestic Leading Stars for Warner Bros. Movies (Rank 101-200) 143 $289,427,397
Top Domestic Leading Stars for Universal Movies (Rank 301-400) 332 $88,634,237
Top Domestic Leading Stars for Sony Pictures Movies (Rank 201-300) 242 $95,308,367
Top Domestic Leading Stars for Paramount Pictures Movies (Rank 501-600) 574 $32,078,318
Top Domestic Leading Stars for 20th Century Fox Movies (Rank 201-300) 204 $120,850,590
Top International Leading Stars for Walt Disney Movies (Rank 401-500) 401 $124,685,916
Top International Leading Stars for Warner Bros. Movies (Rank 201-300) 225 $269,362,536
Top International Leading Stars for Universal Movies (Rank 201-300) 294 $97,164,028
Top International Leading Stars for Sony Pictures Movies (Rank 201-300) 253 $101,000,000
Top International Leading Stars for 20th Century Fox Movies (Rank 301-400) 356 $53,850,663
Top Worldwide Leading Stars for Walt Disney Movies (Rank 401-500) 405 $240,334,904
Top Worldwide Leading Stars for Warner Bros. Movies (Rank 101-200) 178 $558,789,933
Top Worldwide Leading Stars for Universal Movies (Rank 301-400) 314 $185,798,265
Top Worldwide Leading Stars for Sony Pictures Movies (Rank 201-300) 267 $196,308,367
Top Worldwide Leading Stars for Paramount Pictures Movies (Rank 601-700) 629 $32,078,318
Top Worldwide Leading Stars for 20th Century Fox Movies (Rank 201-300) 298 $174,701,253

All Technical Credits


Register with The Numbers for free to customize this chart.

Release
Date
TitleRoleDomestic
Box Office
International
Box Office
Worldwide
Box Office
Apr 19, 2019Be Natural: The Untold Stor… Executive Producer $115,705$77,578$193,283
May 13, 2016Money Monster Director $41,012,075$52,454,020$93,466,095
UnknownSugar Kings Director
Sep 14, 2007The Brave One Executive Producer $36,793,804$32,998,900$69,792,704
Nov 3, 1995Home for the Holidays Director
Producer
$17,468,887$4,650,382$22,119,269
Dec 14, 1994Nell Producer $33,592,700$33,592,700
Oct 9, 1991Little Man Tate Director $24,989,789$24,989,789
 
Averages $25,662,160$22,545,220$40,692,307
Totals 7 $153,972,960$90,180,880$244,153,840


Director Credits


Register with The Numbers for free to customize this chart.

Release
Date
TitleOpening
Weekend
Maximum
Theaters
Domestic
Box Office
Worldwide
Box Office
Domestic
Share
May 13, 2016Money Monster $14,788,1573,104$41,012,075$93,466,09543.9%
UnknownSugar Kings
Nov 3, 1995Home for the Holidays $4,007,7171,000$17,468,887$22,119,26979.0%
Oct 9, 1991Little Man Tate 1,012$24,989,789$24,989,789100.0%
 
Averages $9,397,9371,705$27,823,584$46,858,38474.3%
Totals 4 $83,470,751$140,575,153


Producer Credits


Register with The Numbers for free to customize this chart.

Release
Date
TitleOpening
Weekend
Maximum
Theaters
Domestic
Box Office
Worldwide
Box Office
Domestic
Share
Nov 3, 1995Home for the Holidays $4,007,7171,000$17,468,887$22,119,26979.0%
Dec 14, 1994Nell $62,6631,236$33,592,700$33,592,700100.0%
 
Averages $2,035,1901,118$25,530,794$27,855,98589.5%
Totals 2 $51,061,587$55,711,969