March 15th, 2017

There are a few Oscar-nominated films on this week’s list. However, it was still hard to come up with a Pick of the Week release. Most of them were like Elle with great reviews and weak extras. The DVD for Drunk History: Season Four has more than two hours of extras, but I admit it is an acquired taste. Fortunately, we do have a clear winner: The Love Witch on Blu-ray.
More...
February 28th, 2017
-1-News.jpg)
It is not a particularly long list of new releases this week, but there are several that are must haves. This includes Doctor Strange, which was named Pick of the Week last week. Other contenders for that title include The Gate on Blu-ray, The Raid: Collection on Blu-ray, and Moonlight on Blu-ray. In the end, it wasn’t too hard to select Moonlight as Pick of the Week. However, The Gate does earn Puck of the Week for Best Canadian Release.
More...
February 26th, 2017
It’s Oscar night and we were live blogging the show. Read on the the highlights of what turned out to be a crazy night.
More...
February 26th, 2017

It’s Oscar night and we will be live blogging the show. Before that, let’s take a last look at the nominations with a few annotations. Nominees in italics are those that have received the most votes from our readers so far in our Oscar contest (which is open to new entries until noon, Pacific, today—enter now!). Bold films are those films I think will win. Meanwhile, those that are Underlined are those I want to win. Not all categories have underlined nominees, because not all categories have someone I’m cheering for, or because there are two nominees I couldn’t pick between.
More...
February 24th, 2017

With our annual Oscar Prediction contest underway, now is the best time to look at the nominees and try and figure out who the favorites are and which films should just feel honored to be nominated. Today we look at the final category: Best Picture. It is not a competitive category with an overwhelming favorite, a long shot with a shot, and then rest have maybe a combined 2% chance of winning.
More...
February 23rd, 2017

Kedi remained in first place with an average of $11,418 in seven theaters. It is doing quite well for a documentary. The only other film in the $10,000 club was Chapter and Verse with $10,928 in its lone theater.
More...
February 22nd, 2017
-2-News.jpg)
With our annual Oscar Prediction contest underway, now is the best time to look at the nominees and try and figure out who the favorites are and which films should just feel honored to be nominated. Today we look at the two Screenwriting Categories, finishing with Best Adapted Screenplay. This is a harder category to judge, because the consensus favorite, Moonlight, was considered an original screenplay by nearly everyone else.
More...
February 16th, 2017

With our annual Oscar Prediction contest underway, now is the best time to look at the nominees and try and figure out who the favorites are and which films should just feel honored to be nominated. Today we look at Best Leading Actor, which is a three-way race this year. This makes it one of the most competitive categories we will be talking about.
More...
February 15th, 2017
With our annual Oscar Prediction contest underway, now is the best time to look at the nominees and try and figure out who the favorites are and which films should just feel honored to be nominated. Today we look at the Supporting Roles categories, starting with Best Supporting Actress. In this category, we have one overwhelming favorite, a long shot with a shot, and then everyone else.
More...
February 12th, 2017

The BAFTA winners were announced on Sunday and there were very few surprises to talk about. La La Land again won the most awards with five, while only two other films, Lion and Manchester by the Sea, earned more than one award. They each won two.
More...
January 31st, 2017
-1-News.jpg)
There was only one film the $10,000 club this past weekend, The Salesman, which earned an average of $23,693 in three theaters.
More...
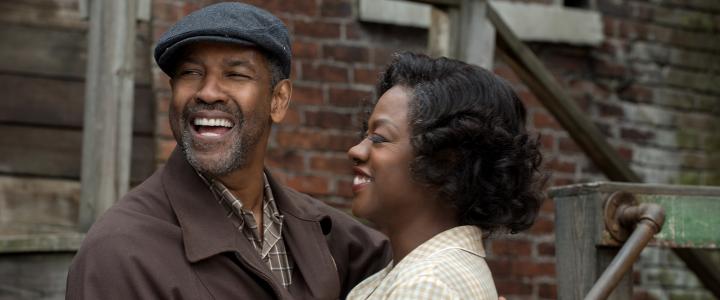
January 29th, 2017
The Screen Actors Guild were handed out tonight and there were a couple of surprises to talk about. There was no one big winner. Hidden Figures won the most prestigious category, but Fences was the only film with multiple wins.
More...
January 29th, 2017
-1-News.jpg)
An impressive decline of 34% in its second weekend and a crop of middling to poor performances by new releases will be enough to keep Split safely at the top of the box office chart this weekend. With Universal projecting $26.3 million for the weekend as of Sunday morning, Split is well ahead of the studio’s new release, A Dog’s Purpose, which will come in with around $18.4 million. Split will finish the weekend with around $78 million in total.
More...
January 24th, 2017
The Oscar nominations were announced starting at 5:18 am Pacific time. Nothing is good that early in the morning. Worse still, it’s a boring year for nominations with very few surprises worth talking about, especially in the biggest categories. Leading the way was La La Land with 14 nominations, tying the record.
More...
January 18th, 2017
-1-News.jpg)
Despite earning 50% positive reviews, Worlds Apart topped the theater average chart with $16,353 in its one theater. The only other film in the $10,000 club was 20th Century Women, which spent its third week there with an average of $10,894 in 29 theaters.
More...
January 11th, 2017

The Producers Guild of America finally finished announcing their nominations. (They spread out their announcements for reasons I’ve never quite understood.) Most of the films on this list have already earned more than a few previous nominations. We appear to be settling into a predictable Awards Season.
More...
January 11th, 2017
The BAFTA nominations were announced and it should come as no surprise what film lead the way... La La Land with 11 nominations, Nocturnal Animals and Arrival are tied for second with nine nominations a piece.
More...
January 10th, 2017

The theater average chart was dominated by holdovers, as is the norm this time of year. The top film was Patriots Day with an average of $14,972 in seven theaters. This bodes very well for its wide expansion next weekend. 20th Century Women is becoming a sleeper hit earning an average of $13,047 in ten theaters. This is one of those films that should be earning more Awards Season buzz, but I fear it has slipped between the cracks. Toni Erdmann and Paterson were neck-and-neck with averages of $10,472 and $10,205 respectively.
More...
January 8th, 2017

The first major awards night was Sunday with the Golden Globes being handed out. La La Land led the way with seven wins, winning in every category it was nominated in. This is great news for its Oscar chances, but there’s already backlash building.
More...
January 4th, 2017

The Writers Guild of America is the latest group nominees to be announced. There are a lot of categories that WGA hand out awards, but only three of them are theatrical releases. The list of nominees include several major Awards Season players, like Hidden Figures, but there are also some surprises.
More...
January 4th, 2017

Hidden Figures rose to first place during its first full weekend of release with an average of $34,329 in 25 theaters. It already has more than $2 million and it expands wide on Friday. 20th Century Women was next with an average of $27,800 in four theaters. It isn’t a major player during Awards Season, but it is picking up enough nominations to help it stick around in theaters. Patriots Day was down just 8% earning an average of $21,117 in seven theaters. Last week’s winner, Silence, fell to an average of $20,827 in four theaters. If it has a similar drop next week, it will put its wide release in jeopardy. The best limited release of the week was Paterson, which earned an average of $17,334 in four theaters. Toni Erdmann earned an average of $14,000 in three theaters during its first full week of release. La La Land continues to expand, but remained in the $10,000 club with an average of $12,738. The overall number one film, Rogue One: A Star Wars Story, was next with an average of $11,934, while the second place film, Sing, was right behind with an average of $10,647.
More...
January 4th, 2017

The final weekend of the year wasn’t as potent as we had predicted, but there were still a number of reasons to celebrate. Rogue One: A Star Wars Story won the weekend and is on its way to becoming the biggest hit of the year. Sing was relatively close behind and will get to $200 million this upcoming weekend. Overall, the box office rose by 2.9% from last weekend hitting $186 million. This is 15% lower than the same weekend last year, which again was actually the first weekend of 2016. We need to switch to the Strowbrinian Calendar. I’m not kidding about this. As for the year-over-year comparison, that’s a little confusing. If you just look at the calender years, then 2016 broke the record earning $11.4 billion. However, the movie year actually begins the first Monday of the year and ends the final Sunday before the first Monday of the next year. Going by this definition of the year, 2016 actually just failed to overtake 2015, because we lost a few days of The Force Awakens and only got one extra day of Rogue One.
More...
December 31st, 2016

Rogue One: A Star Wars Story and Sing continue to dominate the box office, which is great news for us, as Disney and Universal are practically the only major studios releasing numbers this weekend. The holidays are incredibly important at the box office, but they also make our job harder to do. As for the actual box office numbers, Rogue One led the way with $18.18 million on Friday for an 15-day total of $393.55 million. This is lower than expected and it will fall week-to-week; however, it will finish the three-day weekend with just over $50 million becoming the third film released in 2016 to get to $400 million domestically in the process. It also remained on pace for $500 million domestically and $1 billion worldwide.
More...
December 29th, 2016

The weekend after Christmas Day is usually a boring weekend with no wide releases to speak of. On the other hand, we do have a monster hit to keep track of, as well as some Awards Season hopefuls that are expanding significantly and could make the top ten. Of course, Rogue One: A Star Wars Story will win this weekend and it should in fact grow from last weekend, because Christmas Eve is a dead zone at the box office. Likewise, Sing should grow even better, as it is the last weekend for families to hit theaters before school starts. Some of the other films that debuted last week are not looking so good. This weekend last year was actually the first weekend of 2016, which makes it harder to compare the two weekends. Again, we need to switch to the Strowbrinian Calendar that I mentioned at the end of the December Preview. The Force Awakens earned just over $90 million and while Rogue One won’t match that, it should be closer than most were expecting.
More...
December 21st, 2016
-1-News.jpg)
This week is an utter mess when it comes to new releases. There are five films opening or expanding wide this week, three of them opening on Wednesday. Assassin’s Creed, Passengers, and Sing are all trying to get a head start on the weekend, while Why Him? debuts on Friday. Finally, Fences is expected to expand wide on Sunday, Christmas Day, but we’ve seen recently that “wide expansion” isn’t a meaningful term when studios use it. None of these films are expected to top Rogue One: A Star Wars Story, or even come close. Comparing this weekend to the same weekend last year is nearly impossible, because Christmas Eve lands on Saturday this year and Christmas Eve is a dead zone at the box office, while last year it landed on the Thursday, which is the best day of the week for optimal box office numbers. On the other hand, Monday is Boxing Day, which is a holiday for some. It doesn’t balance out, but fortunately 2016 still has a substantial lead over 2015, so even a really bad weekend won’t put 2016 behind.
More...
December 20th, 2016

Rogue One: A Star Wars Story led the way on the theater average chart with an average of $37,306. This wasn’t that far above the second place film, Fences, which earned an average of $32,366. Meanwhile, last week’s winner, La La Land, was pushed into third place with an average of $20,510.
More...
December 18th, 2016

Rogue One: A Star Wars Story is set for the second-biggest weekend in December, third-biggest weekend of 2016, and twelfth-biggest weekend of all time, with Disney predicting a weekend of $155 million, as of Sunday morning. Needless to say, that’s a great result for the Star Wars spin-off, beating the studio’s pre-release guidance, and hitting or exceeding the numbers that most in the industry were expecting. Our model predicted $151 million as of yesterday morning, so the film is maintaining its momentum through the weekend, and there are some reasons to believe that Rogue One may beat Disney’s Sunday projection.
More...
December 17th, 2016

There’s a lot of great news coming out of Friday. For starters, Rogue One: A Star Wars Story earned $70.07 million. This means its previews were 41% of its opening day figure, compared to 48% for The Force Awakens. I was expecting Rogue One to bounce back a little bit from its previews, but not this much. If Rogue One merely maintains The Force Awakens’ internal multiplier, it will earn $148 million over the weekend. There are some positive factors and some negative factors. For example, not all schools are closed on Monday, so it won’t be able to hold onto its box office numbers on Sunday, at least not as well as The Force Awakens did. However, its prospects improved from the afternoon shows to the evening shows and that shows word-of-mouth is strong. This makes sense, as its reviews have settled at 84% positive and it scored an A from CinemaScore. An opening weekend of $150 million is certainly within reach; our model is predicting $151 million. Disney is predicting a more cautious $145 million to $150 million.
More...
December 16th, 2016

Rogue One: A Star Wars Story scared away most wide releases and limited releases. That’s not to say there is nothing on this week’s list worth checking out. In fact, Fences was bumped up a week before its wide expansion on Christmas day. That is the only film on this list likely to have any presence at the box office.
More...
December 14th, 2016
The Screen Actors Guild were the third group to announce their nominations for this awards season. So far there have been three different films earning the most nominations. This could mean the Oscar race will be a lot closer than in past years. This time around Manchester by the Sea led the way with four nominations.
More...
December 12th, 2016
The Golden Globes nominations were announced and we are starting to see a few names pop up over and over again. La La Land led the way with seven nominations, but Moonlight was right behind with six and Manchester by the Sea earned five. You will be hearing those three names over and over and over again this Awards Season.
More...
December 1st, 2016

November was good, but not great. Fortunately, 2016 had a large enough lead going into November that the month only needed to be good. In fact, it could have been mediocre and 2016 would have still had an excellent shot to end the year above 2015. As for December, it’s a race between Star Wars and Star Wars. Almost no one thinks Rogue One is going to match The Force Awakens, but if Rogue One earns just half of what The Force Awakens managed, then 2016 will come out on top in the year-over-year comparison. There are only two other films with a better than 50/50 chance of hitting $100 million, Passengers and Sing. Either one could earn second place for the month, but Passengers will likely start faster. Last December, the only other film to earn more than $100 million was Daddy’s Home, which earned just a hair over $150 million. There’s a chance both Passengers and Sing will earn more than $150 million, which would be a boon to the box office. However, Star Wars: The Force Awakens was just too strong last year and it would take a miracle for 2016 to have a stronger December. That said, it would take a complete collapse for 2016 not to top 2015 in raw dollars. The growth might not be enough to keep pace with ticket price inflation, on the other hand.
More...