May 23rd, 2015
New releases were not terrible, which makes this week on the Blu-ray sales chart better than the past couple of weeks. Taken 3 earned first place with 253,000 units / $5.03 million over the week for an opening week Blu-ray share of 37%. Its raw numbers are significantly lower than Taken 2's opening week Blu-ray sales. Additionally, its opening week Blu-ray share was just 37%, which is lower than most action films. Then again, its reviews were awful, so even fans of the franchise might not be interested in spending extra to get the high definition version.
More...
May 15th, 2015
None of the new releases were able to top the DVD sales chart leaving The Hobbit: The Battle of the Five Armies in first place with 73,000 units / $1.10 million over the week for a total of 1.13 million units / $16.92 million.
More...
May 15th, 2015
It was a bad week on the home market and none of the new releases sold more than 100,000 units on the Blu-ray sales chart. This includes the new number one release, Batman vs. Robin, which only sold 80,000 units / $1.34 million. This is much better than it performed on DVD and its opening week Blu-ray share was 65%.
More...
April 27th, 2015
Last week, the home market was boosted by Easter, but this week, the home market returned to Earth. It returned to Earth and crashed through the crust and halfway to the mantle. With no new releases in the top ten on the Blu-ray chart, while Interstellar had no legs on top. Overall, the Blu-ray market was down 66% in terms of units and 60% in terms of revenue when compared to last week. When compared to last year it was even worse down 66% in terms of both units and revenue. DVDs also fell, but were a lot stronger than Blu-ray were this week and the overall Blu-ray share slipped to 34%. That's really bad.
More...
April 27th, 2015
There were no new releases to chart this week. However, there was a new film in top spot, or to be more accurate, a returning film in top spot. The Hobbit: The Battle of the Five Armies reclaimed first place with 109,000 units / $1.63 million for the week, giving it totals of 1.06 million units / $15.82 million after three weeks of release.
More...
April 27th, 2015
There was only one new release to chart this week and it didn't reach the top five. It barely reached the top 20. This means the top of the Blu-ray sales chart is mostly the same as it was last week. Interstellar remained in first place with 120,000 units / $2.46 million for the week and 839,000 units / $16.68 million after two.
More...
April 20th, 2015
The home market was good, for the most part, thanks in large part to Interstellar. The Blu-ray sales chart was mixed when compared to last week up 13% in terms of units, but down 9.7% in terms of revenue. It was much stronger when compared to last year with 21% more units sold and 16% higher revenue. DVDs were even stronger, on the other hand, so the overall Blu-ray share slipped to 42%.
More...
April 20th, 2015
Interstellar was the top new release and the top selling DVD. However, its opening week numbers were decidedly not stellar. The film sold 291,000 units and generated $4.45 million in revenue. This is barely more than The Hobbit: The Battle of the Five Armies managed during its second week of release.
More...
April 20th, 2015
It was Easter the week the March 31st new releases came out and this had an effect with several, mostly family friendly films earning a boost on the Blu-ray sales chart. Even so, Interstellar opened in first place dominating the rest of the market. The film sold 732,000 units and generated $14.46 million in revenue, for an opening week Blu-ray share of 72%. Granted, this is a film that relies heavily on its special effects to draw in the audience, but that is still a shockingly high percentage.
More...
April 13th, 2015
The Blu-ray sales chart nearly bounced back entirely up 51% in terms of units and 75% in terms of revenue when compared to last week. Having a trio of $100 million hits, The Hobbit: The Battle of the Five Armies, Into the Woods, and Unbroken, enter the home market helps. The Blu-ray sales almost caught up to last year, with 11% fewer units sold, but 5.2% more revenue generated. Blu-rays were just a little stronger this week than DVD were and the overall Blu-ray rose a tiny bit to 45%.
More...
March 30th, 2015
This week on the home market is another week that is good on top, but shallow in terms of depth. The number one film of the week is Interstellar which is worth checking out, but not Pick of the Week material. There are a quartet of Pick of the Week contenders, including two limited releases (The Imitation Game - Buy from Amazon: DVD or Blu-ray and Wild - Buy from Amazon: DVD or Blu-ray) and two TV on DVD releases (VEEP: Season 3 - Buy from Amazon: DVD or Blu-ray and Silicon Valley: Season 1 - Buy from Amazon: DVD or Blu-ray). Of these four, I went with Veep as the Pick of the Week.
More...
March 30th, 2015
Interstellar is the latest film from Christopher Nolan, a director who has performed amazingly well at the box office. He's also never directed a film that earned bad reviews. Is this film as good as his past record? Or are there flaws starting to show in his directing style?
More...
February 22nd, 2015
The Oscar ceremony is tonight and we will be live-blogging the winners... assuming I don't get bored and wander away. On a serious note, while my job is all about movies and I love watching movies, I love paying attention to box office numbers, I even love Awards Season. I hate ceremonies. As per usual, here is the list of nominees marked according to predictions / wishes. Nominees in Bold are the ones predicted to win by our readers. If I predicted a different film, those are in Italics. Meanwhile, the nominees I want to win, but don't think will win, are Underlined. There are a few categories where the film I really think deserves the award were not even nominated, plus a few I don't have a real opinion on.
More...
February 8th, 2015
The BAFTA winners were announced on Sunday and there were a few surprises, including the number one winner. The Grand Budapest Hotel took home five awards, while Boyhood, The Theory of Everything, and Whiplash earned three each.
More...
January 17th, 2015
The Oscar nominations were announced early in the morning, when all sensible people were asleep. There were some surprises, as well as some results that would have been surprises had it not been for the previous Awards Season nominations. Seventeen films earned two or more nods, led by Birdman and The Grand Budapest Hotel, both of which picked up nine nominations, while The Imitation Game was right behind with eight.
More...
January 11th, 2015
The BAFTA nominations were announced yesterday and unlike most other Awards Season voters, the BAFTA voters gave us some real surprises. For instance, Birdman didn't lead the way. In fact, it was a comedy, The Grand Budapest Hotel, that earned the most nominations at 11. Granted, Birdman and The Theory of Everything were tied for second place with ten each, but it is still strange to see a comedy leading the way.
More...
December 17th, 2014
The Hobbit: The Battle of the Five Armies started its international run earning first place with $122.2 million on 15,395 screens in 37 markets. Not only did it earn the best opening of The Hobbit Trilogy, but it was often times the biggest opening in Peter Jackson's career, or even occasionally in Warner Bros' history. Its biggest opening came in Germany where it pulled in $20.5 million on 1,442 screens. Next up was the U.K. and France, which had nearly identical openings of $15.2 million on 1,489 screens and $15.1 million on 914 screens respectively. It earned $13.56 million on 2,390 screens in Russia. Brazil and Mexico were neck-and-neck with $6.8 million on 1,037 screens and $6.3 million on 2,775 screens respectively. It earned $2.4 million on 640 screens in Japan, which seems low compared to the other markets, but it is nearly double the debut The Desolation of Smaug earned.
More...
December 11th, 2014
The Golden Globes nominations were announced this morning, at three in the morning, because the people at Golden Globes are under the delusion that news announced at 3:00 a.m. is somehow more important if it is announced before anyone is awake. As for the actual nominations, like with the Independent Spirit Awards and the SAG nominations, Birdman led the way. It earned seven nominations, while Boyhood and The Imitation Game tied for second with five apiece. Starting to notice a pattern here? This could be a really dull Awards Season with very few surprises. On the other hand, predictable means less work for me. Plus, predictable probably means the Awards Season voters are making the right choices, as surprises usually mean someone made the wrong choice.
More...
December 11th, 2014
The Hunger Games: Mockingjay, Part 1 reached a couple of milestones hitting $500 million worldwide before the weekend and $300 million internationally during the weekend. Over the weekend, the film pulled in $32.9 million in 87 markets for three-week totals of $306.6 million internationally and $564.8 million worldwide. The film will top $600 million worldwide over the weekend, while it is on pace to top the original's worldwide total before the end of its run.
More...
December 9th, 2014
The post-holiday weekend is rarely a great weekend and this weekend was no exception. The Hunger Games: Mockingjay, Part 1 fell more than 60%, while no film in the top ten fell less than 40%. The only wide release in the top ten was The Pyramid, which barely topped the Mendoza Line. Overall, the box office fell 52% from last weekend to $78 million. That's 16% lower than the same weekend last year. Year-to-date, 2014 is behind 2013 by a 4.5% or $440 million margin. It is not going to close that margin over the next four weeks, but it should still top $10 billion before the year is over.
More...
December 5th, 2014
It's the weekend after Thanksgiving, one of the worst weekends of the year for a new release. This year, no film is daring to open wide, but The Pyramid is coming the closest opening in just under 600 theaters. The film would need a per theater average of more than $10,000 to reach the top five, which is nearly impossible at this stage. This means the top five this week will mostly be the same as the top five last week with The Hunger Games: Mockingjay, Part 1 leading the way. Likewise, this weekend last year, Frozen led the way with more than $30 million. There is very little chance Mockingjay, Part 1 will match that, so 2014 will lose yet again in the year-over-year comparison.
More...
December 4th, 2014
The Hunger Games: Mockingjay, Part 1 remained in first place with $67.0 million in 86 markets for a two-week total of $254.6 million. Its worldwide total rose to $480.3 million. I would be surprised if the film hasn't already broken even, even though it will have the lowest box office in the franchise. The film remained in first place in Australia with $7.52 million on 574 screens over the weekend for a total of $22.69 million after two weeks of release. It was pushed into second place in the U.K., but still pulled in $7.69 million in 569 theaters for a two-week total of $33.32 million.
More...
December 2nd, 2014
Thanksgiving weekend was... well, it wasn't good. The Hunger Games: Mockingjay, Part 1 easily won the race for top spot and actually topped expectations by a tiny margin. On the other hand, the two new releases, Penguins of Madagascar and Horrible Bosses 2, both really struggled. Neither managed to top their three-day prediction over the five-day long weekend. Overall, the three-day weekend fell 17% to $162 million from last weekend. Worse still, this was 22% lower than the same weekend last year. 2014 is now behind 2013 by a margin of $370 million or 3.9% at $9.20 billion to $9.58 billion. There's no way we will catch up by the end of the year. I just hope we don't fall further behind.
More...
November 27th, 2014
It's Thanksgiving weekend and there are two films trying to take advantage of the boost to the box office. Penguins of Madagascar looks like it will top Horrible Bosses 2 at the box office, but neither really have a shot at dethroning The Hunger Games: Mockingjay, Part 1 for top spot. In fact, it is possible both of them combined won't top last year's number one new release, Frozen. Additionally, Mockingjay, Part 1 very likely won't match Catching Fire by a significant margin, so November will end the month on a down note.
More...
November 27th, 2014
The Hunger Games: Mockingjay, Part 1 opened in first place on the international chart with $154.3 million in 85 markets for a worldwide opening of $276.2 million. Its international opening was about 4% higher than the previously entry in the franchise. The film managed $19.8 million in the U.K. and $13.8 million in Germany. This was 5% and 9% higher than the previous film's debut in those two markets. Mockingjay, Part 1 opened 19% higher in Russia with $11.9 million. The film also topped $10 million in Mexico ($12 million) and Australia ($10.3 million).
More...
November 24th, 2014
As expected, The Hunger Games: Mockingjay, Part 1 earned first place with ease pulling in more than the rest of the box office combined. On the downside, it was well below the optimistic expectations at just $121.90 million. ... It seems strange that an opening of $121.90 million is considered disappointing. Worse still, none of the other films in the top five topped predictions, so they couldn't help mitigate Mockingjay, Part 1's softer than anticipated opening. The overall box office still rose 38% from last weekend to $194 million, but this was 14% lower than the same weekend last year. There's really no way to spin that in a positive manner. Year-to-date, 2014 has earned $8.94 billion, which is 3.2% or $290 million lower than last year's pace. Again, it is hard to spin that number in a positive way.
More...
November 23rd, 2014
If you could sum up 2014 at the box office in one sentence, this weekend’s headline probably comes close. The Hunger Games: Mockingjay — Part 1 is the film we’ve been waiting for all year: the third film in a franchise that has already topped $150 million on each of its previous two opening frames, with the weekend before Thanksgiving all to itself, and reviews that, if not stellar, are at least very respectable for a franchise tentpole. A weekend of $150 million plus seemed a very good bet, and something bigger still couldn’t be ruled out. But, come Sunday, Lionsgate is projecting a $123 million weekend, down about 20% from previous installments. That is, of course, a fantastic weekend by most measures: it’s the 15th-best weekend of all time, and easily the biggest opening weekend in 2014. But this will now be the first year since 2010 without a $150m+ weekend, and the debate about the waning influence of theater-going on the industry will undoubtedly be re-opened.
More...
November 20th, 2014
There is only one wide release coming out this weekend, but it is the biggest release of the year. The Hunger Games: Mockingjay, Part 1 should have no trouble earning the biggest opening weekend of the year so far and it shouldn't take very long before it surpasses Guardians of the Galaxy for number one film of the year. As for the rest of the box office, there's not a lot to look forward to. Dumb and Dumber To will likely take a serious hit, while Big Hero 6 should overtake it over the weekend. This weekend last year, Catching Fire led the way with $158.07 million, which could be more than the entire box office earns this year. Hopefully that won't be the case, but I don't see how 2014 comes out ahead on the year-over-year comparison.
More...
November 20th, 2014
Interstellar remained in first place with $107.9 million in 63 markets over the weekend for totals of $225.8 million internationally and $322.7 million worldwide. This might be enough to cover the film's production budget, but probably not. That said, by this time next week, its worldwide total will be close to $500 million, which should put the film in the black. This weekend the film opened in first place in China with $42.67 million during its five-day opening. Perhaps more impressively, the film grew by 6% in South Korea helping it remain in first place with $13.13 million on 1,410 screens over the weekend for a total of $35.24 million after two weeks of release. It didn't hold up quite as well in the U.K., but still remained in first place with $5.91 million on 576 screens over the weekend for a total of $19.11 million.
More...
November 18th, 2014
There was some good news and bad news over the weekend. The good news was Dumb and Dumber To, which managed a stronger than expected opening, despite its reviews. The bad news was Beyond the Lights, which couldn't turn its reviews into box office success. That said, the good outweighed the bad and overall the box office was quite strong. It was still down 11% from last weekend to $140 million, but that's still 12% more than the same weekend last year. 2014 remains behind 2013's pace by 3.4% or $310 million at $8.72 billion to $9.03 billion, but every little victory will help soften the blow at the end of the year.
More...
November 16th, 2014
The box office chart is starting to take on a decidedly seasonal look, with a comedy sequel topping the chart, a smattering of Oscar hopefuls doing well in limited release, and not a single top 10 film dropping by more than 50% from last weekend. The comedy sequel, Dumb and Dumber To, will narrowly win the weekend with a shade over $38 million, per Universal’s Sunday estimate. That’s $2 million more than Big Hero 6 will post in its second weekend in release. The animated adventure will be off just 36% from last weekend. Also posting an impressive hold from a big opening weekend is Interstellar, with $29.1 million—39% below its opening frame.
More...
November 13th, 2014
It is a slower weekend at the box office than last weekend. Granted, there are two films opening wide, but neither of them are expected to be a huge hit. Dumb and Dumber To is earning terrible reviews, but it is expecting to earn first place at the box office. Beyond the Lights is earning much better reviews, but it will likely only become a midlevel hit at best. As far as holdovers are concerned, both Big Hero 6 and Interstellar will continue to be big factors at the box office, but only these four films have a shot at $10 million or more at the box office. This weekend last year, Thor: The Dark World led the way with $36.59 million while The Best Man Holiday opened in second place with $30.11 million. I think the one-two punch this year will be better, plus we will have a lot more depth leading to 2014 earning a win in the year-over-year comparison.
More...
November 13th, 2014
As expected, Interstellar opened in first place on the international chart earning $82.90 million on 14,800 screens in 62 markets during its opening weekend. As you may or may not know, we introduced a new comprehensive look at the international numbers, so there's little more than needs to be said here. I will point out that the film's opening in South Korea was particularly strong at $12.46 million on 1,310 screens over the weekend, for a total opening of $14.21 million. The film also opened in first place in the U.K., with $8.53 million on 1,298 screens, which is about on par with its domestic opening, given the relative size of the two markets. Russia was close behind with $8.00 million on 1,800 screens. The film opened in China this week and those numbers should help the film remain in first place next weekend.
More...
November 12th, 2014
There were four films in the $10,000 club, including The Theory of Everything, which led the way with an average of $41,753 in five theaters. This is high enough to make some measure of mainstream success nearly inevitable. Up next were a pair of wide releases. Big Hero 6 earned an average of $14,947, while Interstellar was right behind with an average of $13,342. The final film in the $10,000 club was National Gallery, which earned $10,049 in one theater over the weekend for a total opening of $13,165.
More...
November 10th, 2014
We had two potential monster hits go at it over the weekend and it appears the competition was a little too much and neither Big Hero 6 nor Interstellar lived up to lofty expectations, although Big Hero 6 was close. Combined the two movies earned more than $100 million over the weekend, which is reason to celebrate, even if the rest of the box office barely registered. Overall, the box office rose 65% from last weekend reaching $157 million. Wow. Unfortunately, this was still 6.5% lower than the same weekend last year. Had Interstellar matched expectations, 2014 would have come out on top of the year-over-year comparison. Hopefully it will have better legs than Thor: The Dark World did, or this weekend could be another loss. I'm hopeful, because The Dark World was a pretty big Fanboy film.
More...
November 10th, 2014
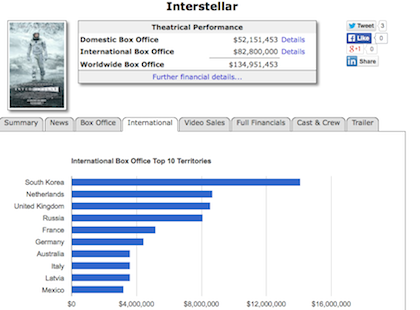
We’re pleased to announce another new feature at The Numbers today: comprehensive international box office tracking. This new coverage will include detailed breakdowns of the international performance of leading films, including weekend-by-weekend coverage in each territory, with updates as soon as we receive numbers from sources worldwide. Our tracking differs from other sources in a number of key aspects, all designed to provide the most comprehensive, timely, and accurate breakdown of the international performance of films in theaters (more on that below the fold). The first film we’ll be tracking is Interstellar, and we’ll be adding new movies regularly.
More...
November 9th, 2014
With studios cutting down on tentpole releases, and ever-more careful grooming of release schedules, it’s getting rarer to have a genuine head-to-head battle for top spot at the box office. But that’s exactly what we had this weekend, and, although both studios will rightly claim to be very happy with the outcome, execs at Disney will have the slightly bigger grins this Sunday. They are predicting a $56.2 million opening weekend for Big Hero 6, making it a clear winner over Interstellar, which Paramount says will post a round $50 million.
More...
November 6th, 2014
November begins with a powerful one-two punch. Both Interstellar and Big Hero 6 are expected to open with more than $50 million. On the high end, they could both clear $60 million. Interstellar was expected to win by a sizable margin, but its Wednesday IMAX opening was not quite as strong as expected, so it could be a closer than expected weekend. Those two films should easily pull in more than $100 million over the weekend, but unfortunately the rest of the box office will be well back. This weekend last year was similarly top-heavy with Thor: The Dark World earning $85.74 million, which was more than the rest of the box office combined. It looks like the year-over-year competition could be quite close, but I have to give 2014 the edge.
More...
October 31st, 2014
October was a better than expected month with the overall box office keeping pace with October of 2013, for the most part. (The last weekend will be terrible, but that's because of Halloween.) We were able to close the gap somewhat in the year-over-year comparison, at least by a little bit. So how will November do compared to October. Let's put it this way. There are only seven films opening wide this month. Of those, Beyond the Lights will likely not make an impact at the box office. Every other film has at least a reasonable shot at $100 million. More than half the of the films opening this month could hit $200 million. Leading the way will be The Hunger Games: Mockingjay, Part 1, which could hit $400 million. The only problem is when book franchises split the final installment into two parts, the first part tends to be weaker at the box office. Interstellar is a big question mark. On the low end, it could make just over $100 million, while on the high end, just over $300 million is within reach. That's a wide range of expectations. On the downside, last November, there were two movies to reach $400 million: Catching Fire and Frozen. On the other hand, there was only one other movie to make more than $100 million, Thor: The Dark World, so perhaps the depth this year will help 2014 come out ahead in the year-over-year comparison.
More...
October 30th, 2014
Next weekend, Interstellar and Big Hero 6 open wide. I think Interstellar will be the bigger film; however, it is opening on IMAX on Wednesday and I'm not sure if the studio will lump those figures into the weekend numbers and that's an added complication I don't want to deal with. Because of this, Big Hero 6 is the target film for this week's box office prediction contest. In order to win, one must simply predict the opening weekend box office number for Big Hero 6.
The prizes this week are codes for a UV digital HD download for The Blair Witch Project. There's actually only supposed to be one code as a prize and one is supposed to be going to me, but I already own the move on Blu-ray, so I thought I would give away both codes as prizes.
Whoever comes the closest to predicting the film's opening 3-day weekend box office (Friday to Sunday),
without going over, will win a code for a UV digital HD download for
The Blair Witch Project.
Whoever comes the closest to predicting the film's opening 3-day weekend box office (Friday to Sunday),
without going under, will also win a code for a UV digital HD download for
The Blair Witch Project.
Entries must be received by 10 a.m., Pacific Time on Friday to be eligible, so don't delay!
More...


-Thumbnail.jpg)