May 2nd, 2012
There were not a lot of new releases to reach the top 30 on the DVD sales chart this week and only one of them reached the top five. We did have a new number one film, as Mission: Impossible - Ghost Protocol easily topped the chart with 661,000 units / $10.24 million. This is a disappointing start for a film that made $200 million in theaters. Fortunately, it did better on Blu-ray.
More...
April 25th, 2012
This literally could turn out to be the worst week of the year on the Blu-ray sales chart. The best-selling new release was The Darkest Hour, which only managed 158,000 units / $3.17 million. The only good news is the film's opening week Blu-ray share, which was an impressive 54%.
More...
April 25th, 2012
It was a bad week for DVD, which is common at this time of year. The Iron Lady was the best of the new releases, but it only managed second place. War Horse climbed into top spot with 244,000 units / $4.67 million over the week for totals of 830,000 units / $14.62 million after two.
More...
April 10th, 2012
It is a really slow week on the home market. The biggest theatrical release coming out is The Iron Lady. The film did extremely well for a limited release, but that's not saying a whole lot. The only other wide release is The Darkest Hour, but that film bombed quite badly, so it likely won't have much of an impact on the home market. As for the best of the best, A Trip to the Moon Blu-ray is at the top of the list and is the Pick of the Week. There are a couple runner-ups, namely Astonishing X-Men: Dangerous on DVD and Into the Abyss on Blu-ray
More...
April 9th, 2012
The Iron Lady opened on January 30th, the second to final day to qualify for Oscars. You know it was made to win awards. However, while Meryl Streep earned praise, and an Oscar, for her performance, the overall reviews were far less glowing. Was the film flawed outside of the lead performance? Or were the expectations just too high?
More...
February 28th, 2012
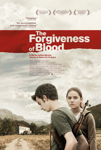
It was another slow week on the per theater chart with no film topping $10,000. The closest any film got was The Forgiveness of Blood with an average of $8,908 in three theaters. Goon's opening is also worth noting, as it made $1.27 million in 258 theaters in Canada. It is very rare for a Canadian film to open in more than a handful of theaters, while opening with more than $1 million almost never happens. It would be nice if the film could replicate this success in the States, but it is monstrously unlikely.
More...
February 26th, 2012
It's Oscars night. (Actually, it's 3:43 in the morning as I'm typing this, but I thought I would get a jump on the celebration.) As I do every year, I will follow the announcements live and update our list of Oscar winners. However, this year I will be doing it a little differently and the list of nominees below will include the favorites as picked by our readers in Italics and as picked by me in Bold. So you can watch live and tell when I'm out of the running for our Oscar contest. (I figure it will take at least 17 wins out of 24 to come out on top. Maybe even 18 or 19 wins.) So, will The Artist be the big winner tonight as our readers predict? Or will Hugo score the upset? Stay tuned to fine out.
More...
February 16th, 2012
With our annual Oscar Prediction contest underway, now is the best time to look at the nominees and try and figure out who the favorites are and which films should just feel honored to be nominated. This week we will look at the four acting categories, finishing with Best Actress. This category is a little tricky, as there are two actresses that can both be seen as the favorite for different reasons. I'm not sure who will win.
More...
February 8th, 2012
An Inconsistent Truth repeated on top of the per theater chart with $12,176 in one theater. However, while it won, it fell more than 40%, which is closer to a wide release than a limited release. W.E. was very close behind with an average of $11,769 in four theaters.
More...
January 31st, 2012
There was only one film to reach the $10,000 mark on the per theater chart this past weekend. An Inconsistant Truth opened with $20,733 in its lone theater, but with still no reviews, its long term chances are still unknown. The phrase, "preaching to the choir" does spring to mind.
More...
January 25th, 2012
There were only three films this past weekend to reach the $10,000 mark on the per theater average, and none of them were new releases. Pina finally expanded playing in ten theaters, while it climbed to the top of the per theater average with $13,667. It should hit its first major milestone soon. A Separation doubled its theater count and saw its per theater average grow to $12,986. It too should reach its first milestone sooner rather than later. The final member of the $10,000 club was We Need to Talk About Kevin with an average of $10,530 in seven theaters. The best new release of the week was Crazy Horse with $7,963 in its lone theater. However, it was a Wednesday release and if you include its first two days of release, it earned $12,336. If it were a Friday release, it likely would have reached the $10,000 market.
More...
January 24th, 2012
Yesterday was one of the biggest days during Awards Season as The Oscar nominations were announced in the morning. It was a two horse race for top spot as far as the big winners are concerned. Hugo earned the most nominations with eleven, while The Artist was right behind with ten. However, one could argue The Artist is the bigger winner, as more of its nominations were in the more prestigious categories.
More...
January 18th, 2012
It was a busy week on the per theater chart with five films in the $10,000 club; however, all but one of those films were holdovers. Leading the way was We Need to Talk About Kevin, which returned to theaters after its week-long Oscar qualification run. It earned an average of $21,123 in two theaters. Pina doubled its theater count, but remained strong in second place with an average of $20,740 in six theaters. Even if it doesn't expand significantly, it will reach some major milestones. Despite mixed reviews, Extremely Loud and Incredibly Close is earning very strong legs. This past weekend it dipped just 8% while earning an average of $15,172 in six theaters. It expands wide on Friday and it should do quite well. The only new release of the week to reach the $10,000 club was Sophomore, which opened with an estimated $13,000 in its lone theater. Finally, we get to A Separation, which earned an average of $11,977 in six theaters. Hopefully it will expand to take advantage of is success thus far.
More...
January 18th, 2012
Martin Luther King, Jr. Day long weekend was mostly filled with good news, with all three films doing at least respectable business, while we had a couple holdovers which beat expectations. Contraband was surprisingly strong earning top spot with relative ease. And while it couldn't match The Green Hornet's debut from last year, the overall box office was very solid at $132 million over three days and $163 million over four. The three-day total was 5% lower than last weekend, but 1.5% higher than last year. The four-day total was 2.6% higher than last year. It's obviously way too early to judge 2012's box office run, but at the moment it is 14% higher than last year's pace at $483 million to $423 million.
More...
January 16th, 2012
The Hollywood Foreign Press Association handed out the Golden Globes last night, and after an Awards Season most notable for the lack of surprises, there were not a lot of surprises either. In fact, the biggest storyline of the night was how many different movies earned wins. The Artist led the way with just three, while The Descendents was the only other film to win more than once.
More...
January 15th, 2012
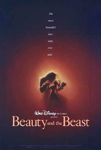
With Beauty and the Beast disappointing slightly over the 3-day MLK frame, Contraband will take first place by a fairly comfortable margin, according to studio estimates released on Sunday. The action movie is set to pick up about $24.1 million, per Universal, while Disney pegs Beast's Friday-Sunday total at $18.5 million. Joyful Noise will bring in a solid, if slightly disappointing, $11.3 million for Warner Bros..
More...
January 12th, 2012
This weekend is Martin Luther King, Jr. Day, which is not one of the biggest long weekends at the box office. (It is just too close to Christmas / New Year's to really help boost the box office significantly.) There are three films opening wide, Beauty and the Beast 3D, Contraband, and Joyful Noise, plus another film, The Iron Lady, which is expanding enough that it could reach the top ten. I don't think any of them will match last year's winner, The Green Hornet, which pulled in $33.53 million during its opening weekend. However, one can hope all three wide releases reach their potential and 2012 will come out ahead of 2011.
More...
January 10th, 2012
The $10,000 club was again crowded this week and, as expected for this time of year, it was filled almost entirely by holdovers. Iron Lady remained the top film with an average of $35,275 in five theaters and it should start hitting major milestones very soon. Pina's average grew, again, reaching $27,676 in three theaters. Hopefully it will start expanding quickly, before its momentum fades. Extremely Loud and Incredibly Close earned an average of $16,521 in six theaters. Its mixed reviews haven't taken too much of a toll, yet. A Separation doubled its theater count, but its per theater average remained relatively steady at $15,440. The overall box office leader, The Devil Inside, was next at $14,763. Finally, Once Upon a Time in Anatolia opened with $10,652 in one theater.
More...
January 8th, 2012
The Devil Inside came out of nowhere to win this weekend's race at the box office, according to studio estimates released on Sunday. Its $34.5 million debut is well ahead of expectations and will likely place it second or third on the list of all-time January opening weekends when final numbers are released on Monday. (See full list of January record weekends.) This performance is a welcome boost to overall business, which is coming off a disappointing 2011. Total box office for the weekend should be about 30% up from this weekend last year.
More...
January 4th, 2012
The winners of our Ho Ho Ho contest were determined and they are...
More...
January 4th, 2012
Iron Lady led a group of six films in the $10,000 earning a per theater average of $55,102. This is better than expected and shows the Oscar buzz for Meryl Streep is overcoming the middling overall reviews. Last week's winner, Pina, remained strong with an average of $23,874 in three theaters. I expect it will expand somewhat and earn a small measure of mainstream success. A Separation opened with an average of $19,827 in three theaters and with possible Oscar glory, it continues to do well. Tinker Tailor Soldier Spy has already earned a significant measure of mainstream success and with an average of $19,043 in 55 theaters this past weekend, it had its best weekend yet. It did cost $21 million to make, so it will need to continue to do well for quite some time before it makes profitability likely. Extremely Loud and Incredibly Close's first full weekend went well earning an average of $18,463 in three theaters. It has a shot at expanding wide in a couple weeks, assuming it holds on relatively well over the next couple weeks. The final film in the $10,000 club was Pariah, which earned an average of $12,145 in four theaters. It earned just over $100,000 from Wednesday through Monday.
More...
January 1st, 2012
Mission: Impossible will enjoy another weekend at the top of the chart, according to studio estimates released on Sunday, and 2011 will end on a small uptick from 2010, but a lackluster Holiday Season overall will cap a year where the total box office will fall around 3% and ticket sales will be down 4%, making the year as a whole the worst for ticket sales since 1995 (full historical analysis here).
More...
December 30th, 2011
It's the last chance for films looking to earn some Oscar glory and there are three films on this week's list looking to do just that. Unfortunately, the film earning the most buzz, The Iron Lady, is also earning the weakest reviews out of those three. Fortunately, the other two films are earning perfect reviews (A Seperation) or near perfect reviews (Pariah) so moviegoers have options.
More...
December 29th, 2011
The New Year's Eve weekend is one of the most prosperous at the box office, but it also usually has no wide releases. This is the case this year, for the most part. War Horse and The Darkest Hour will have their first full weekends at the box office, but that's as close as we have to a new release. This means it is unlikely there will be many major changes in the ranking of the top five films and Mission: Impossible: Ghost Protocol has a clear shot at first place. Also, because Christmas Eve fell on Saturday, we should see strong growth across the board. Anything less than double-digit growth by any film will be considered a disappointment. This means we could actually end 2011 on a winning note compared to 2010. It wouldn't be enough to make a difference in the big picture, but a win is a win.
More...
December 23rd, 2011
There are no wide releases next week, so our box office prediction contest will be a little tougher than usual, as the target film is a limited release, and these are harder to predict. On the other hand, we have three prizes, so no matter how off you are in your prediction, you still have a shot at winning something. With the release of The Iron Lady, Meryl Streep is looking to capture her third Oscar win and I believe her 70th nomination, but more importantly, it is the target film in this week's contest. In order to win, one must simply predict the opening weekend box office number for The Iron Lady.
Whoever comes the closest to predicting the film's opening 3-day weekend box office (Friday to Sunday), without going over, will win a copy of Futurama: Volume 6 on DVD, as well as Glee: Season Two on DVD.
Whoever comes the closest to predicting the film's opening 3-day weekend box office (Friday to Sunday), without going under, will also win a copy of Futurama: Volume 6 on DVD, as well as Star Wars: Lego: The Padawan Menace on DVD. (The Amazon link is for the Blu-ray, but we have the DVD as a prize.)
Finally, one additional entrant will be chosen and they will win the final copy of Futurama: Volume 6 on DVD.
Entries must be received by 10 a.m., Pacific Time on Friday to be eligible, so don't delay!
More...
December 16th, 2011
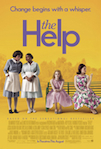
The Hollywood Foreign Press Association announced their nominations and the Awards Season picture started to look a whole lot clearer. The Artist led the way with six nominations, while The Descendents and The Help were right behind with five apiece.
More...
December 15th, 2011
The SAG nominations were handed out this week, and while The Help led the way with four nods, it wasn't the only film that earned multiple nominations.
More...