April 4th, 2012
New releases really dominated the Blu-ray sales chart taking the top four spots and five of the top six. Leading the way was The Muppets with 967,000 units / $24.16 million. Its opening week Blu-ray ray share was 52%, which is stunning for a live action family film. In fact, it's would good for a visually impressive action film.
More...
March 28th, 2012
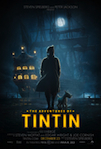
The Adventures of Tintin led all new releases and took top spot on the Blu-ray sales chart. It sold 504,000 units and generated $11.09 million in opening week sales. This represents an opening Blu-ray share of very nearly 50%, which is an excellent start for a kids film.
More...
March 27th, 2012
Like last week, new releases dominated the DVD sales chart this week with three new releases topping the chart. The best of the best was Happy Feet Two with 896,000 units / $13.43 million during its first week on the home market. The film struggled at the box office, so this start on the home market is better than expected.
More...
March 13th, 2012
There are two themes this week. The first is Awards Season. There are no fewer than half a dozen Award Season players on this week's list, although one was a late review. Speaking of late reviews, that's the other theme on this week's list, as there are no fewer than eight releases on this week's list where I'm waiting for the screener to arrive. (This includes Wizards which arrived on Monday; however, screeners need to arrive by Friday if I'm to get the review done on time.) Unfortunately, there's a lot of crossover among these two groups and a few Pick of the Week candidates are late. For instance, My Week with Marilyn and Melancholia fit into both groups. Other screeners I'm waiting for that could be Pick of the Week are Wallace & Gromit: World of Invention and the aforementioned Wizards: 35th Anniversary Blu-ray, while The Guild: Season Five was up for that honor as well. However, in the end I went with The Descendants on Blu-ray Combo Pack.
More...
January 24th, 2012
Yesterday was one of the biggest days during Awards Season as The Oscar nominations were announced in the morning. It was a two horse race for top spot as far as the big winners are concerned. Hugo earned the most nominations with eleven, while The Artist was right behind with ten. However, one could argue The Artist is the bigger winner, as more of its nominations were in the more prestigious categories.
More...
January 22nd, 2012
Producers Guild of America handed out the winners tonight and instead of solidifying Oscar prospects, they might have opened things up a bit more. At least in my mind there are more questions than answers after tonight. So what nominees took home the awards?
More...
January 16th, 2012
The Hollywood Foreign Press Association handed out the Golden Globes last night, and after an Awards Season most notable for the lack of surprises, there were not a lot of surprises either. In fact, the biggest storyline of the night was how many different movies earned wins. The Artist led the way with just three, while The Descendents was the only other film to win more than once.
More...
January 5th, 2012
Mission: Impossible: Ghost Protocol remained in first place on the international chart with $45.86 million on 7,342 screens in 50 markets for a total of $227.01 million internationally and $359.42 million worldwide. This includes a first place, $12.77 million opening on 509 screens in the U.K. It had to settle for second place in Mexico with $1.32 million on 1,065 screens over the weekend for a total opening of $6.64 million and in Brazil with $1.04 million on 501 screens over the weekend and a total opening of $6.02 million. The film has almost caught up with Mission: Impossible: III and is closing in on the average for the franchise.
More...
January 4th, 2012
The winners of our Ghost of a Chance contest were determined and they are...
More...
January 4th, 2012
The nominees for this year's Producers Guild of America were announced and there were not a lot of surprises. For instance, nine of the ten nominees for Theatrical Motion Pictures also earned Golden Globe Nominations for either Best Drama or Best Musical / Comedy. Four of the five Animated films also did the same. It does make the Awards Season picture a lot clearer going forward, but it makes coming up with something to say much harder.
More...
January 3rd, 2012
2011 ends and 2012 begins, but the new beginnings didn't change. The overall box office rose to $155 million over the weekend, $200 million if you include Monday. This is higher than last weekend, but since Christmas landed on the weekend, this was to be expected. It is troubling that for the three-day portion of the weekend, the box office was 3% lower than last year, which is weaker than expected. 2011 ended with $10.22 billion, which was 3% lower than 2010. Attendance was down 4%, meaning the year had the lowest tickets sales since 1995. We can only hope the next 52 weeks are better than the last 52 weeks were.
More...
December 29th, 2011
The New Year's Eve weekend is one of the most prosperous at the box office, but it also usually has no wide releases. This is the case this year, for the most part. War Horse and The Darkest Hour will have their first full weekends at the box office, but that's as close as we have to a new release. This means it is unlikely there will be many major changes in the ranking of the top five films and Mission: Impossible: Ghost Protocol has a clear shot at first place. Also, because Christmas Eve fell on Saturday, we should see strong growth across the board. Anything less than double-digit growth by any film will be considered a disappointment. This means we could actually end 2011 on a winning note compared to 2010. It wouldn't be enough to make a difference in the big picture, but a win is a win.
More...
December 27th, 2011
Due to the placement of Christmas Day, we are still dealing with mostly studio estimates for weekend numbers. However, while we wait for the final numbers, we can look at some of these early results and compare them to expectations and in some cases use them predict how these films will end their theatrical runs. (In some cases, there's not enough information to guess where it will go in the future.) As for the overall box office numbers, we don't know if the final tally will be higher or lower than last year, but I'm not optimistic.
More...
December 21st, 2011
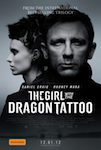
This year Christmas is a mess, when it comes to the box office. There are six films opening or expanding wide spread over six days. This includes The Girl with the Dragon Tattoo, which was bumped up at the last minute and opened on Tuesday. At the other end of the time frame, War Horse and The Darkest Hour don't open till Sunday. The number of films virtually guarantees at least two will struggle at the box office, but hopefully by spreading out the releases, moviegoers will be able to spread their daily movie contact among the new releases. That is if people will bother going to the movies. The longer the slump continues, the more likely it is due to a systemic issue. When people stop going to the movies, they don't see as many trailers and posters for upcoming releases and they are less excited about upcoming releases and, therefore, they are less likely to see movies in the future. It's a vicious cycle. Last year wasn't a great weekend at the box office, because Christmas Eve, which is a dead zone at the box office, landed on a Friday. This year it lands on a Saturday, so it could be even worse.
More...
December 16th, 2011
Next week is a mess when it comes to new releases. While there are five films opening wide or expanding wide next week, only one of those is doing so on the Friday, but I don't think it will be the biggest hit of the week. The biggest hit of the week should be Mission: Impossible: Ghost Protocol, but that opens tonight before expanding on Wednesday. The second biggest should be The Adventures of Tintin: Secret of the Unicorn, and since it should be the biggest new release of the week, it is the target film in this week's contest. In order to win, one must simply predict the opening weekend box office number for The Adventures of Tintin: Secret of the Unicorn.
Whoever comes the closest to predicting the film's opening 3-day weekend box office (Friday to Sunday), without going over, will win a copy of Family Guy: Volume 9 on DVD.
Whoever comes the closest to predicting the film's opening 3-day weekend box office (Friday to Sunday), without going under, will also win a copy of Family Guy: Volume 9 on DVD.
Entries must be received by 10 a.m., Pacific Time on Friday to be eligible, so don't delay!
More...
December 16th, 2011
The Hollywood Foreign Press Association announced their nominations and the Awards Season picture started to look a whole lot clearer. The Artist led the way with six nominations, while The Descendents and The Help were right behind with five apiece.
More...
December 15th, 2011

For the first time in four weeks, we had a new number one film on the international chart, as Puss In Boots continued its climb reaching top spot. It expanded into 16 additional markets, including a handful of major ones. This propelled it into first place with $47.06 million on 6,749 screens in 40 markets for a total of $143.72 million, which is just over what it has made domestically. The film's biggest debuted was Germany, where it earned top spot with $6.88 million on 680 screens, including previews. It was even more impressive in Brazil with $5.56 million on 738 screens, also including previews. Brazil is more of an emerging market than a major market, so the fact that it generated more revenue than its openings in either Australia ($4.03 million on 507 screens, including previews) or in the U.K. ($3.07 million on 510) is quite stunning. With debuts in Italy, Japan, and other markets ahead of it, not to mention the Christmas holiday, it could double what it currently has internationally, which would lift its worldwide total over $400 million.
More...
December 7th, 2011
For the third weekend in a row, The Twilight Saga: Breaking Dawn, Part 1 earned top spot on the international chart, this time with $40.2 million on 9,000 screens in 73 markets. It now has totals of $341 million internationally and $588 million worldwide. Its biggest opening of the weekend came from South Korea, where it made $3.22 million on 706 screens for a total opening of $5.12 million. Its biggest running tally comes from the U.K. where it has made $42.76 million, including $2.61 million on 523 screens this past weekend.
More...
December 1st, 2011

Well... game over. At the beginning of November, 2011's total box office was $340 million behind 2010's pace. We needed that gap to be closed significantly by the end of the month, but it actually grew wider. So now that there's virtually no chance that 2011 will avoid a year-over-year decline at the box office, not unless there's a surprise Avatar coming out this month. But is there at least some hope for the next four weeks? Last December six films reach $100 million, including one that opened in limited release and expanded wide, but none reached $200 million. This year, four are practically sure bets at $100 million, including one or two that could reach $200 million. Plus, there are four others that should make between $75 million and $100 million. I doubt all of them will reach the century mark, but if one did, it wouldn't be a shock. Then there's a couple of limited releases that should expand wide and, maybe, if one of them becomes the big play during Awards Season, it could reach $100 million as well. Even if every film beat expectations, 2011 won't come out ahead. But maybe if enough do, we can at least end the year on a high note. Unfortunately it has come down to that. Instead of talking about the box office record being broken, we are hoping 2011 doesn't end on yet another sour note.
More...
November 30th, 2011
The Twilight Saga: Breaking Dawn, Part 1 remained in top spot on the international chart with $76 million on 10,500 screens in 68 markets for a total of $268 million internationally and $489 million worldwide. It has already topped the first film in the franchise and by the end it should improve upon the franchise's international average. Its best new market was Germany, at $10.89 million on 789 screens over the weekend, for a total opening of $13.70 million. Meanwhile, its best holdover was the U.K., where it added $7.11 million on 546 screens to its two-week total, which sits at $36.24 million.
More...
November 23rd, 2011

The Twilight Saga: Breaking Dawn, Part 1 wasn't the only film playing internationally, but it might as well have been with how much it dominated the box office. It opened with $152.9 million on 9,950 screens in 54 markets for a global opening of $291.0 million. This was the best opening for the franchise so far, although Part 2 will likely top it. Its biggest opening came from the U.K. where it managed $21.84 million on 543 screens, while it also topped the chart in Russia with $15.85 million on 1,268. It earned nearly identical results in Italy ($12.10 million on 719) and in Australia ($12.01 million on 618). Other first place results include Spain ($11.73 million on 957); Brazil ($10.29 million on 1,008); and Mexico ($10.12 million on 2,176). On the other hand, it had to settle for second place in France, but still managed a very strong $14.85 million on 759 screens. The film opens in Germany this weekend, while it doesn't finish its run till February when it debuts in Japan.
More...
November 16th, 2011
Immortals opened in first place internationally with an estimated $38 million in three dozen theaters. (Because the film's international run is being handled by multiple studios, getting exact numbers was delayed.) Its biggest market was Russia, where it earned first place with $8.68 million on 1,236 screens, while it earned $5.5 million in China. The film also debuted in first place in South Korea with $3.99 million on 633 screens over the weekend for a total opening of $4.95 million. It took top spot in the U.K. with $3.45 million on 428 screens and in Germany with $2.63 million on 440. On the other hand, it bombed in Japan earning just $1.26 million on 462 screens over the weekend for a total opening of $1.69 million.
More...
November 9th, 2011
The Adventures of Tintin: Secret of the Unicorn remained on top of the international chart during its second weekend of release, while it crossed the $100 million milestone over the weekend. It expanded into more than two dozen new markets, but most were of the smaller variety. Overall, it made $38.98 million on 7,103 screens in 45 markets, for a total of $123.55 million so far. Russia was the only real exception, where it opened in second place with $4.81 million on 788 screens. It plummeted 74% in France, but still added $6.99 million on 850 screens for a two-week total of $33.44 million. On the other hand, it remained in first place in Spain with $5.19 million on 819 screens over the weekend, for a total of $16.62 million after two. At this point, $200 million internationally is a given, which is likely close to the film's total budget. If it can close close to that figure here, it will break even before the lucrative home market.
More...
November 3rd, 2011
The Adventures of Tintin: Secret of the Unicorn doesn't open here till a few days before Christmas, but it led the way on the international chart with an astonishing $56.56 million on 5,699 screens in 19 markets. Its biggest opening was in France, where it managed $26.97 million on 850 screens. That's like a $150 million opening here. It's a record for a non-sequel in that market. It wasn't as impressive in the U.K., but it did score $10.83 million on 512 screens, which is equivalent to a $50 million to $60 million opening here. These results will force me to re-evaluate its box office potential with an above $200 million run a lot more likely now. Granted, the source material is better known in Europe, plus it will have a lot more competition when it debuts here, but this is still a great sign going forward.
More...
November 1st, 2011
Puss in Boots was the biggest IMAX draw domestically earning $2.2 million on 269 screens, while it also made $900,000 on 25 IMAX screens internationally. Meanwhile, The Adventures of Tintin: Secret of the Unicorn started its international run well ahead of its domestic debut, pulling in $1.2 million on 28 screens. This bodes well for its potential here.
More...
January 20th, 2011
There were a trio of news items relating to IMAX this past week, starting with box office numbers for The Green Hornet, which were good, but not great. The film managed $3.0 million on 173 screens over four days, which gave it a per screen average significantly higher than in regular theaters, but not by as much as some other releases. I think this was because it was a better than expected marginal release. There were likely two groups of people who were on the fence about this movie: those that wanted to see it, but weren't willing to pay IMAX prices, and those who wanted to see it, but were willing to wait for the home market. Better than expected reviews are more likely to change the minds of the latter group than the former, resulting in a higher than expected overall box office, but not as much change in IMAX. That said, this is still a good result, especially for this time of year.
More...
March 28th, 2008
This week's round of new casting information contains updates for Crazy on the Outside, Two Lovers, W., and more!
More...
December 20th, 2007
This week's round of new casting information contains updates for Four Christmases, My Sister's Keeper, Quarantined, and more!
More...
December 13th, 2007
This week's round of new casting information contains updates for Julie & Julia, A Plumm Summer, Yes Man, and more!
More...