October 11th, 2016
-2-News.jpg)
Ghostbusters is the biggest release of the week and the best first run release. Combined with its fully-loaded Blu-ray (extended edition), it is a Pick of the Week contender. There’s not much competition. The main competition is a new Collector's Edition Blu-ray for The Thing, but this is at least a double-dip, which hurts its value. There are a couple of smaller releases as well. In the end it was a literal coin toss to decide the Pick of the Week and Ghostbusters won.
More...
September 27th, 2016

It is a pretty good week on the home market with a few releases worth picking up. The biggest of these is Central Intelligence, but while it is worth picking up, it isn’t a contender for Pick of the Week. There are some smaller releases that were up for that title, including The Shallows, An American Werewolf in London and The Innocents. However, in the end, I went with Captain America: Civil War. The Blu-ray screener arrived late, and I held off on naming it Pick of the Week when it came out for that very reason.
More...
September 7th, 2016

Star Trek Beyond climbed into first place for the first time in its run with $37.0 million in 40 markets for totals of $131.1 million internationally and $285.4 million worldwide. The film earned first place in China with a total opening of $30.92 million, including previews. It was not as strong in Brazil, where it earned $1.6 million on 479 screens. The film is doing well enough that it should break even, eventually, but it is not a truly monster hit.
More...
August 31st, 2016
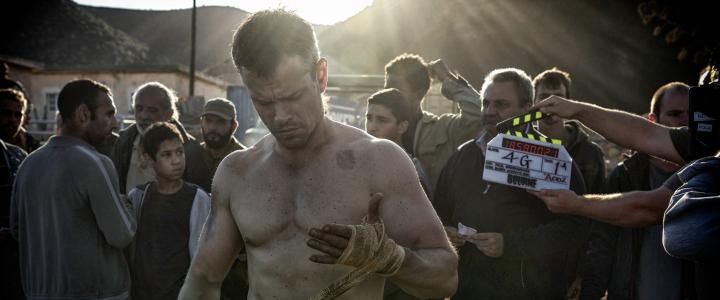
Jason Bourne returned to first place with $56.2 million on 10,247 screens in 62 markets for totals of $197.73 million internationally and $347.01 million worldwide. The film earned first place in China with $23.96 million over the weekend for a six-day opening of $49.13 million. The entire six day opening is included in the weekend number. Its total in China is already better than the lifetime totals for any other film in the franchise. The film wasn’t quite as potent in Mexico, but it still did well earning first place with $1.53 million over the weekend, which is the best opening in the franchise.
More...
August 19th, 2016

War Dogs got off to a surprisingly strong start with $1.9 million during its midnight previews last night. This is about 20% more than Mike and Dave Need Wedding Dates made a few weeks ago. The two films are great comparisons, but we don’t have a lot of other films to work with. This is good news for the film and makes it likely that it will beat predictions by a small margin.
More...
August 10th, 2016

As expected, Suicide Squad easily won the international box office race pulling in $132 million in 57 markets. However, its results in individual markets were mixed when compared to its domestic opening, as well as when compared to Batman v Superman. For example, the film earned first place in Russia with $11.42 million over the weekend, while BvS opened with $7.84 million. It is also a little better than its debut here, given the size of the two markets, and the slumping rubles. On the other hand, the film managed $13.9 million in the U.K., compared to BvS’s opening of $20.66 million. Likewise, a $13.9 million opening in the U.K. is equivalent to about $90 million here, which is much less than its debut here. That’s still a huge opening, but not a monster opening. BvS finished with over $500 million internationally; if Suicide Squad finishes with just under $400 million internationally, it will break even, so the studio can’t be too upset. They could yell, “Damn the critics, full speed ahead.” and let the D.C. Extended Universe turn into another Transformers. Hit after hit, but critically reviled.
More...
August 2nd, 2016
There was no surprise at the top of the weekend box office chart, as Jason Bourne easily won with $59.22 million. This was on the high end of expectations, but not quite as strong as Star Trek Beyond’s opening last weekend. Both of the other two new releases, Bad Moms and Nerve, also did well. In fact, none of the films we talked about before the weekend missed expectations. The overall box office was down a little compared to last weekend, but a 3.1% decline is hardly noteworthy. More importantly, the box office was 30% higher than the same weekend last year. Year-to-date, 2016 saw its lead over 2015 nearly double to $260 million or 4.0%. Being ahead $6.84 billion to $6.58 billion at this point of the year is a good position to be in, but it wouldn’t take a major collapse for 2016 to fall behind 2015 by year’s end.
More...
July 30th, 2016

Jason Bourne dominated the Friday box office chart, earning $22.71 million. I’ve seen reports that this is the biggest opening day for a Matt Damon movie, but The Bourne Ultimatum did better with $24.67 million. That film also earned much better reviews than this film did, so it likely won’t have the same legs. It did earn an A- with CinemaScore, so that will help a little. It will likely have similar legs to Star Trek Beyond. Beyond did earn better reviews, but Star Trek has a bigger fanboy factor, which hurt its legs. That will give the film $60 million over the weekend, more or less.
More...
July 28th, 2016
The month of July comes to an end this weekend and there are three wide releases hoping the month goes out on a high note. Jason Bourne is the only one with a shot at first place, while Bad Moms is looking to become a solid counter-programming hit. Meanwhile, Nerve opened on Wednesday and it just doesn’t want to slip between the cracks. As far as holdovers are concerned, Star Trek Beyond's daily numbers are average for the summer, but that will still be enough to hit the century mark over the weekend. It won’t be the only film to reach $100 million over the weekend. This weekend last year was led by Mission: Impossible - Rogue Nation with $55.52 million. I don’t think Jason Bourne will top that, but since the second best film, Vacation, made less than $15 million, I think 2016 will win on depth.
More...
July 28th, 2016

Skiptrace earned first place internationally with $47.37 million over the weekend for a total opening of $63.04 million. The film dominated the box office in its native China with $45.58 million last weekend for a four-day opening of $61.25 million. This is the best opening in Jackie Chan's career, but unfortunately, it is only getting a limited release here.
More...
July 26th, 2016
As expected, Star Trek Beyond earned first place on the weekend box office chart and while it didn’t live up to my lofty predictions, it still did very well with $59.25 million. The next two wide releases, Lights Out and Ice Age: Collision Course, had nearly identical openings with $21.69 million and $21.37 million respectively. For Lights Out, this is a breakout opening and means it is practically guaranteed a profit and will likely get a sequel. For Collision Course, it is a sign that they should retire the franchise. Both The Secret Life of Pets and Ghostbusters earned $20 million, meaning every film in the top five topped that mark, tying with the record most recently set last May. The overall box office was 20% higher than last week at $196 million. This is also 29% higher than the same weekend last year. Since last week, the year-over-year competition got a little closer at $6.55 billion to $6.41 billion. 2016 is still ahead by 2.2%, but this is less than the ticket price inflation.
More...
July 24th, 2016
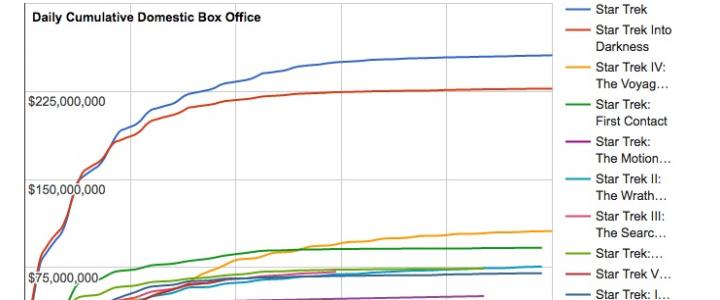
Star Trek Beyond will fall just short of $60 million at the box office this weekend, according to Sunday estimates from Paramount. The studio has the film coming in at $59.6 million over three days, which is substantially short of the $79.2 million earned on debut by Star Trek (the reboot) in 2009, and the $70.2 million made by Star Trek Into Darkness. The so-so start comes in spite of excellent reviews, which are now running at 84% on Rotten Tomatoes, and the franchise seems to have trouble reaching beyond its core audience.
More...
July 23rd, 2016
As expected, Star Trek Beyond led the way on the Friday box office chart, earning $22.5 million. This is in line with the average among analysts, but lower than my prediction. I did warn you about irrational exuberance. Given the film’s reviews and its A CinemaScore, it should have a relatively good internal multiplier. Look for an opening weekend of close to $57 million, which is significantly better than Ghostbusters’ opening with last week and not that much worse than what X-Men: Apocalypse opened with in May. I assume Paramount is happy with this result, but the film will need good legs and a strong international run to justify another sequel.
More...
July 22nd, 2016

Star Trek Beyond got off to a fast start with $5.5 million during its midnight previews. This is $2 million more than Ghostbusters made last weekend, plus it has better reviews. On the other hand, it is a sequel, so the comparison isn’t perfect. We could compare it to the previous installment in the franchise, but that film opened on a Wednesday. X-Men: Apocalypse earned $8.4 million in its previews, but that film earned weaker reviews and is a comic book movie, which tend to be more front-loaded. I was a little more bullish than most with my prediction, but this result make me feel a lot better.
More...
July 21st, 2016
Star Trek Beyond leads a pack of three wide releases this weekend and there are some who think it will have the best live-action release since Captain America: Civil War. That would be great news for the overall box office. Ice Age: Collision Course has to deal with direct competition and terrible reviews, but it should still do relatively well thanks to goodwill its franchise has built up. The final new release of the week is Lights Out. This low-budget horror film won’t need to earn $20 million over the weekend to break even, but there’s a slim chance it will. In fact, The Secret Life of Pets should easily add another $20 million to its running tally, and Ghostbusters has a good shot at doing the same. So we could have five films earning $20 million over the weekend for the first time in a year. We should have three films earning more than $25 million. Meanwhile this weekend last year, there were no films that earned more than $25 million. Hopefully 2016 will win the year-over-year competition with ease.
More...
July 21st, 2016

Ice Age: Collision Course rose to first place with $53.5 million in 51 markets for an early international total of $127.0 million. The film’s biggest new market was France, where it earned first place with $7.07 million on 873 screens. That’s a pretty good opening for that market, but the previous film opened with $12.76 million in that market, so that’s a sizable drop-off. The film also earned first place in Russia with $5.85 million on 1,236, compared to $16.97 million the earlier film opened with. That’s really troubling. Meanwhile, the film had to settle for second place in the U.K. with $4.99 million in 570 theaters. (We can’t really compare openings here. The numbers we get for the U.K. are actually for the U.K., Ireland, and Malta. It’s similar to the domestic market being Canada and the States. In almost all cases this doesn’t matter, because films open in all three countries at the same time. However, Continental Drift opened in Ireland first, before expanding into the U.K., so there’s no easy way to compare the two results.) At this pace, it looks like Collision Course isn’t going to match its predecessor at the box office. However, it could fail to earn half as much worldwide and still break even on the home market. This might be the last installment in the franchise, on the other hand.
More...
July 14th, 2016
There are three wide releases opening next week, but there’s not a lot of doubt which film will top the chart. Star Trek Beyond should win this weekend over Ice Age: Collision Course, although both should have no trouble getting to $100 million domestically. Meanwhile, Lights Out is nothing more than counter-programming and if it tops $50 million, it will be seen as a serious hit. Because there doesn’t seem to be a race for top spot, Star Trek Beyond is the target film in this week's Box Office Prediction contest. In order to win, one must simply predict the opening weekend box office number for Star Trek Beyond.
Whoever comes the closest to predicting the film's opening 3-day weekend box office (Friday to Sunday), without going over, will win a winners’ choice Frankenprize consisting of either a multi-disc TV on DVD release, two previously reviewed movies, or three single-disc kids DVDs.
Whoever comes the closest to predicting the film's opening 3-day weekend box office (Friday to Sunday), without going under, will also win a winners’ choice Frankenprize consisting of either a multi-disc TV on DVD release, two previously reviewed movies, or three single-disc kids DVDs.
Finally, we will be choosing an entrant from the group of people who haven't won, or haven't won recently, and they will also win a winners’ choice Frankenprize consisting of either a multi-disc TV on DVD release, two previously reviewed movies, or three single-disc kids DVDs.
Entries must be received by 10 a.m., Pacific Time on Friday to be eligible, so don't delay!
More...
July 13th, 2016

Cold War 2 opened in first place with $44.25 million in four markets over the weekend. Nearly all of its opening came from China, where it made $44.08 million over the weekend and $44.78 million, including previews. It also opened in the U.K. earning $128,000 in 14 theaters, which is great for a limited release there.
More...
July 7th, 2016

Independence Day: Resurgence remained in first place on the international chart with $40.2 million in 64 markets for totals of $177.0 million internationally and $249.9 million worldwide. Its biggest new market was Spain, where it earned $1.7 million. Meanwhile, its biggest holdovers were China ($11.64 million over the weekend for a two-week total of $66.67 million) and the U.K. ($2.69 million in 603 theaters for a two-week total of $12.16 million). Overall, the movie is doing fine, but the film set up an obvious sequel, so the studio was obviously hoping for more than just fine.
More...
July 1st, 2016

It's July 1st, which is Canada Day. To celebrate, I wanted to give a gift to my American readers down south, so here's a bunch of "u"s. U, u, u, u, u, u, u, u, u, u, u, u, u, u, u, u, u, u, u, u, u, u, u, u, u, u, u, u, u, u, u, u, u, u, u, u, u, u, u, u, u, u, u, u. Now you can spell words like "colour" and "neighbour" correctly. As for the July preview... June wasn't a good month, despite Finding Dory being on pace to become the biggest hit of the year so far. Most other films failed to match expectations and as a result, 2016's lead over 2015 has nearly evaporated. In fact, ticket sales are below last year's pace. So how does July look in comparison? Well, last July, there were five films that earned more than $100 million, led by Minions, which earned more than $300 million. This July, there are five films that should earn more than $100 million, led by The Secret Life of Pets, which should earned around $250 million. I don't think July 2016 will live up to July 2015, but it should be close. Maybe if one of the expected midlevel hits is a surprise $100 million hit, or if two more of the $100 million hits crack $200 million, then the month will look great. Or one of the expected $100 million hits could flop and 2016 will actually fall behind 2015, even without taking into account ticket price inflation.
More...