May 3rd, 2011
The combination of factors ranging from the Fanboy Effect to Easter sales were in relative balance, and this helped Harry Potter and the Deathly Hallows, Part I remain strong. It led all new releases to earn first place on the DVD sales chart this week with sales of 1.99 million units / $27.89 million for the week for totals of 4.43 million units / $62.35 million.
Tangled grew more than 100% thanks to Easter sales, selling an additional 1.04 million units for the week to give the film total sales of 5.59 million units / $85.30 million after a month of release. The King's Speech opened in third place with 893,000 units / $13.39 million, which is great for a limited release, but a little soft for the big Oscar winner.
More...
April 11th, 2011
It was an awesome week for new releases on the sales chart, or should that be "new release". While there were five new releases to chart, one of them, Tangled, dominated selling 3.46 million units while generating $51.92 million in sales. It is already the biggest selling DVD of 2011.
More...
March 30th, 2011
Only four new releases reached the top 30 on this week's sales chart; however, all four landed on the top of the chart. Leading the was way The Fighter with 880,000 units and $13.20 million during its first week on the home market.
Barbie: A Fairy Secret was fairly close behind with 630,000 / $7.86 million. Hereafter was a ways back with 309,000 units / $4.32 million. The final new release to chart was The Switch in fourth place, which was very close behind, especially in terms of dollars, at 288,000 units / $4.32 million. Megamind fell from second to fifth with 267,000 units / $4.00 million for the week and 2.31 million units / $32.66 million after four.
More...
March 21st, 2011
Plenty of new releases reached the top 30 on this week's top 30 DVD sales chart; however, there were not many really worth lauding. Jackass 3D won the way, but with just 569,000 units / $9.80 million, it was not a huge seller.
Megamind was pushed to second place with 368,000 units / $5.20 million for the week and 2.07 million units / $28.95 million after three. It is rapidly becoming the biggest hit of 2011, at least so far. The Walking Dead: Season One placed third in terms of units with 324,000 sold. However, due to its TV on DVD pricing, it placed second in terms of dollars with $5.83 million. The Next Three Days opened in fourth place with 283,000 units / $3.40 million, which is in line with its disappointing theatrical run. Due Date remaining in fifth place, adding 244,000 units / $3.59 million its its total sales, which have reached 1.51 million units / $21.60 million after three weeks of release.
More...
March 15th, 2011
The top selling title on this week's sales chart depends on how you categorize the biggest new release of the week. Since the studio considers the Bambi release as a Blu-ray, Megamind was able to repeat on top with 733,000 units during its first full week of release, lifting its totals to 1.66 million units and $10.25 million.
More...
March 8th, 2011
There was a close race for top spot on the sales chart this week between two new releases. Megamind won that race with 949,000 units / $13.28 million to 923,000 units / $12.92 million for Due Date. But to be fair to Megamind, it went on sale on Friday not Tuesday like Due Date did.
More...
February 28th, 2011
It is an amazingly slow week on the home market with no first run releases that did well enough to be considered midlevel hits. That is if you don't count Megamind, which came out on Friday. There are a few that are worth picking up, but only one is a real contender for Pick of the Week: Bambi on Blu-ray / DVD Combo Pack.
More...
February 24th, 2011
Part of a pair of Super Hero digitally animated films to come out in 2010. Not only that, but they both were from the point of view of the villain. The comparisons between Megamind and Despicable Me are inevitable. How well will Megamind do in this comparison? And can it stand on its own?
More...
February 22nd, 2011
It's a pretty good week on the home market, all things considered, with two $100 million first-run releases on this week's list. On the other hand, there doesn't feel like a whole lot of depth and there are about as many featured reviews as other releases, if you count late reviews and ones where I'm still waiting on the screeners. One of these late reviews, Megamind could be the Pick of the Week, but I'm giving the Blu-ray one last chance to arrive before its release on Friday.
More...
February 9th, 2011

Tangled's international run is coming close to an end, but it has a couple of major milestones left to reach. Over the weekend it added $23.90 million on 5186 screens in 42 markets for a total of $288.33 million internationally and $479.40 million worldwide. At this point next week it will have $300 million internationally and $500 million worldwide. In order to reach profitability before it hits the home market, it will need to get past the $600 million mark worldwide, which is likely out of reach. However, assuming it does well on the home market, reaching profitability is inevitable at this point. This week it opened in Spain with $5.61 million on 650 screens, which was enough for first place over the weekend and the third best Disney debut in that market. Meanwhile, the film was down just 11% during its second weekend of release in the U.K., adding $7.38 million on 448 screens over the weekend for a running tally of $17.35 million. And, it has yet to open in Japan, so it is not done yet.
More...
December 29th, 2010
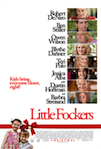
With Christmas just behind us and New Year's Day just ahead, a lot of studios are on vacation, so there are not a lot of details when it comes to box office numbers and we are stuck with studio estimates for the most part. According to these estimates, Little Fockers took top spot with $27 million on 3933 screens in 37 markets during its opening. However, it was such a tight race that once final figures are in, it might slip to second, or even third. Its biggest market was the U.K., where it opened in first place with $7.3 million on 487 screens. By comparison, Meet the Parents made twice that during its debut in 2005. Ouch.
More...
December 22nd, 2010
The Voyage Of The Dawn Treader remained in top spot over the weekend, but it fell more than 50% to $31.53 million on 10,107 screens in 61 markets for a total of $126.02 million internationally. Over the weekend it opened in Germany, but only managed second place with $2.46 million on 893 screens, which is about 40% less than Prince Caspian made during its opening weekend and less than half of what the original opened with. It was down 50% in Russia, but still going strong with $3.89 million on 1284 screens over the weekend for a total of $16.29 million after two. In France it held well, down just 40% to $3.10 million on 739 screens over the weekend and $8.77 million in total. It will not match its predecessors at the box office, but it should make enough internationally that it will break even, eventually.
More...
December 15th, 2010

Like the previous films in the franchise, The Voyage Of The Dawn Treader will clearly be a bigger hit internationally than it will domestically. This weekend it climbed into top spot with $66.18 million on 10,0159 screens in 58 markets for a total of $80.22 million. It opened in first place in Russia with $7.85 million on 1284 screens over the weekend for a total of $10.87 million. Its debut in France was a little stronger than its opening here at $5.15 million on 739 screens, likewise in South Korea with $3.89 million on 562 screens over the weekend and $5.28 million in total. In Mexico it made $3.36 million on 522 screens over the weekend and $7.01 million including previews. On the other hand, it only made $3.87 million on 536 screens in the U.K. By comparison, the first film made more than $15 million in its opening and the second more than $8 million. Its going to need strong holds going forward if it is to have any shot at breaking even. The fact that it fell just 23% during its second weekend in Spain is a hopeful sign. However, it still only managed $2.21 million on 598 screens, while this strong hold was in part due to the total lack of wide releases in that market this past weekend.
More...
December 8th, 2010
Harry Potter and the Deathly Hallows: Part I maintained its lead on top of the international box office chart; however, it saw its weekend haul sliced in half to $57.12 million on 14,188 screens in 62 markets for a total of $473.52 million internationally and $718.04 million worldwide. It became just the 43rd film to reach $700 million worldwide, while it will shortly overtake Up for 40th place overall.
More...
December 2nd, 2010
The weekend after the Thanksgiving long weekend is historically one of the weakest weekends of the year, and by far the weakest during the winter holiday season that runs from November to New Year's. This year it is no exception with only one wide release, The Warrior's Way, and it's not even opening truly wide. This means for the second weekend in a row, there will be a holdover leading the way. However, it might not be the same holdover as last weekend. As for last year, there were three wide releases, none of which did well, but all of which provide some indication on how The Warrior's Way might perform.
More...
November 29th, 2010
As expected, Harry Potter and the Deathly Hallows: Part I led the way on the box office chart, but Tangled was stiffer competition than almost anyone thought it would be. Both were able to outperform the New Moon / The Blind Side one-two punch from last year. But the rest of the chart was not as strong, leading to three-day declines of 3% from last weekend and 6% from last year with $183 million. Over five days, the box office pulled in $264 million, which is again 3% lower than last year. 2010's lead over 2009 has been cut to 2% at $9.66 billion to $9.46 billion, which is not enough to assume 2010 will come out on top in the end, but it should be close.
More...
November 24th, 2010
Its the Thanksgiving long weekend and the official start of the winter holiday blockbuster season. While there are four wide releases making their debut tonight, it will likely be a holdover, Harry Potter and the Deathly Hallows: Part I, that wins the box office race. Such was the case last year when New Moon repeated on top. It will be interesting to see whether or not Harry Potter will have stronger legs, whether or not the new releases get off to faster starts, and whether or not the overall box office is better.
More...
November 23rd, 2010
Harry Potter and the Deathly Hallows: Part I helped the overall box office explode from last weekend. In fact, it earned more than all films last weekend combined, propelling the box office to a 60% week-over-week increase. Unfortunately, the rest of the box office was on the weak side, and the total of $194 million was 25% lower than the same weekend last year. Ouch. 2010 is still ahead of 2009 at $9.36 billion to $9.14 billion, but that lead isn't safe given the sharp drop-off we just suffered. Hopefully we will get back on the winning track soon. Even single-digit loses will ensure 2010 sets another box office record.
More...
November 18th, 2010
The Harry Potter franchise is almost done and records will be broken over the weekend. In fact, at least one record was broken last night, as The Deathly Hallows: Part I had the largest midnight showing ever and it also has the widest IMAX release this weekend.
On the down side, this time last year was also a record-breaking weekend, with New Moon earning top spot for biggest November weekend, so it might be impossible for 2010 to keep pace with 2009 over the next three days.
More...
November 16th, 2010
Only one film in the top five topped expectations over the weekend, while another film came within a rounding error of doing so. This left the overall box office down nearly 20% from last weekend, which combined with last year's monster opening for 2012 means 2010 is off last year's pace by 13%. Year-to-date, 2010 still has a more than $300 million lead at $9.14 billion to $8.84 billion, so a one-week stumble like this is hardly reason to panic.
More...
November 11th, 2010
There could be a three-way race for the top spot at the box office this weekend with two wide releases competing with last week's winner. That's the good news. The bad news is that none of them have a real shot at topping last year's winner. In fact, the worst case scenario has the three wide releases this year opening with less combined than 2012 opened with on its own. Actually, that's not the worst case scenario, as it is pretty damn likely. Even if that does happen, there is a lot more depth this year and 2010 might still earn a solid win overall.
More...
November 11th, 2010
The winners of our Never Mind the Date contest were determined and they are...
More...
November 10th, 2010
Unlike its domestic debut, Due Date was able to open in first place internationally with $21.69 million on 3572 screens in 32 markets. It was tops in Germany with $3.90 million on 519 screens, while it also led the way in the U.K. with $3.78 million on 449 screens. On the other hand, it had to settle for second place in Russia, but with $3.88 million on 543 screens, it was still a huge success there. In comparison, the cumulative opening weekend was nearly identical to The Hangover, which bodes well for the film's chances internationally, even if it likely won't have the same long legs.
More...
November 9th, 2010
MegaMind opened on 195 IMAX screens over the weekend earning an estimated $3 million in the process. This gives the film a per screener average of around $15,000, which is higher than its overall per theater average, but not by a huge margin. Certainly not the huge margins we've come to expect. Internationally the film made $250,000 on 9 screens, which is more inline with previous results.
More...
November 9th, 2010
There were a few limited releases to reach the $10,000 mark on the per theater chart this past weekend. 127 Hours lead the way with an impressive average of $66,213 in four theaters. Fair*Game was well back with $14,154, but it opened in 46 theaters, so this is a much better indicator of its chances to expand. The overall box office leader, MegaMind, was the only other film in the $10,000 club with an average of $11,668, but the second place film, Due Date, came very close with an average of $9,743.
More...
November 8th, 2010
While practically every film in the top five missed expectations, none of them were complete misses and all made enough that they could be considered victories. The overall box office was an incredibly healthy $151 million, which was 59% higher than last weekend and 26% higher than the same weekend last year. In fact, it came within $2 million of the record for the opening weekend of November. 2010 was able to put more distance between it and 2009 and it now leads the year-to-date race $8.97 billion to $8.66 billion. It would take a fairly major collapse for 2010 to not break the record for highest box office, although it will likely fail to top last year in terms of ticket sales.
More...
November 7th, 2010
MegaMind posted a solid $47.65 million to top the weekend chart, according to studio estimates released on Sunday.
That's very much in line with the performance of other opening weekends for non-sequels from DreamWorks Animation.
How to Train Your Dragon opened with $43.7 million earlier in the year; Monsters vs. Aliens posted $59.3 million in 2009, and fellow-November-opener Bee Movie scored $38 million back in 2007.
Bee Movie ended up with $126 million in total in the US, and $150 million looks like the minimum benchmark for MegaMind as it looks forward to the lucrative holiday season.
More...
November 4th, 2010
November could start on a high note with three wide releases poised to open one-two-three. If all three films only manage to reach just the midpoint of expectations, then the month will start with a big win year-over-year, as last year three of the four new releases struggled. If they reach the high end of expectations, then the top three films this week will earn more than the top ten films did last year. Even low end expectations has this year's likely number one film, MegaMind, topping last year's number one film, A Christmas Carol. The only bad news is the lack of depth, as none of the holdovers are poised to do much business. They are either pump and dumps, or have been in theaters so long that they are no longer a real factor.
More...
November 3rd, 2010
Thanks in part to holidays in France, Despicable Me was able to return to top spot with $21.65 million on 4511 screens in 44 markets for a total of $234.58 million internationally and $482.46 million worldwide. By this time next week, it will have more internationally than domestically and a total of more than half-a-billion worldwide. Its top market was France, where school holidays helped it more than double its take at $6.17 million on 657 screens, but that's for the 5-day weekend. Overall it has made $19.80 million in that market. It opened in second place in Japan with $2.93 million on 225 screens over the weekend and $3.12 million in total. It was flat in the U.K. adding another $4.15 million on 532 screens for a three week total of $24.21 million.
More...
November 1st, 2010
November's here and expectations are all over the place. October saw 2010 lose ground to 2009, which is a bad sign going forward, but we also saw records fall. This month will undoubtedly see an increase in ticket sales over last month, what with the start of Awards Season and the Holidays, but the real question is how well it will compare with last year. Last November saw the release of a couple of surprise hits, none more surprising than The Blind Side, while in the end there were five $100 million movies and two that reached $200 million. Will that happen this year? Maybe. I count six films with a statistically significant shot at reaching $100 million, including three that might reach $200 million, and one of those has a shot at $300 million. That is on the high end, but even on the low end there are three $100 million movies coming out this month, including one that is all but guaranteed to reach $200 million in the end.
More...
October 29th, 2010
Our Halloween theme continues, despite the fact that Halloween is this Sunday. Next week we see the opening of MegaMind, which should be the biggest hit of the weekend and is the target film in this week's box office prediction contest. In order to win, one must simply predict the opening weekend box office number for MegaMind.
Whoever comes the closest to predicting the film's opening 3-day weekend box office (Friday to Sunday), without going over, will win a copy of Ghost Whisperer: Season Five on DVD.
Meanwhile, whoever comes the closest to predicting the film's opening 3-day weekend box office (Friday to Sunday), without going under, will win a copy of The Psycho Legacy on DVD.
Entries must be received by 10 a.m., Pacific Time on Friday to be eligible, so don't delay!
More...
October 2nd, 2008
This week's round of new casting information contains updates for Paper Man, Sherlock Holmes, Kung Fu Panda 2, and more!
More...
March 4th, 2008
This week another number of upcoming movies, new stars and directors have been added to our archive!
More...
March 2nd, 2008
This week's round of new movie release information contains release dates for Terminator Salvation: The Future Begins, Where the Wild Things Are, How to Train Your Dragon and more!
More...