March 15th, 2011
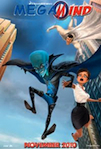
The top selling title on this week's sales chart depends on how you categorize the biggest new release of the week. Since the studio considers the Bambi release as a Blu-ray, Megamind was able to repeat on top with 733,000 units during its first full week of release, lifting its totals to 1.66 million units and $10.25 million.
More...
February 28th, 2011
It is an amazingly slow week on the home market with no first run releases that did well enough to be considered midlevel hits. That is if you don't count Megamind, which came out on Friday. There are a few that are worth picking up, but only one is a real contender for Pick of the Week: Bambi on Blu-ray / DVD Combo Pack.
More...
January 16th, 2011
The Hollywood Foreign Press Association handed out the hardware tonight, and while there were plenty of winners, one film, The Social Network, stood out by winning four awards, including three of the major ones.
More...
December 14th, 2010
The Hollywood Foreign Press Association announced their nominations early this morning, and there are some interesting surprises included in the mix. Leading the way was The King's Speech, which has long been seen as one of the major players this Awards Season. Meanwhile, The Fighter and The Social Network were right behind with six each. There were many, many other films nomination, including more than a few shocks. ... Mostly in one category.
More...
December 9th, 2010
It could be a strong weekend at the box office with two wide releases, both with the potential of earning more than $100 million, perhaps a lot more in one case. This is great news for 2010, as this week last year was not strong. Both Dawn Treader and The Tourist should open with more than The Princess and the Frog did during its debut in wide release, although it could be close for the latter. Combined the two films could make more than the top five did last year. If so, 2010 should win big over 2009, but it will be the last win for 2010, and it still might not be enough to maintain its lead over 2009 in the end.
More...
December 6th, 2010
The past weekend brought very little holiday cheer and the box office plummeted more than 50% from last weekend to just $86 million. To be fair, this was a post-holiday weekend, so that decline was expected, if a little more extreme than we would like. However, it was 13% lower than the same weekend last year and there's no way to sugarcoat that. Year-to-date 2010 still has a lead over 2009, but that lead is now under 2% at $9.78 billion to $9.63 billion. This means in less than a month 2010's lead has been cut in half. This is not a good sign going forward.
More...
December 2nd, 2010
The weekend after the Thanksgiving long weekend is historically one of the weakest weekends of the year, and by far the weakest during the winter holiday season that runs from November to New Year's. This year it is no exception with only one wide release, The Warrior's Way, and it's not even opening truly wide. This means for the second weekend in a row, there will be a holdover leading the way. However, it might not be the same holdover as last weekend. As for last year, there were three wide releases, none of which did well, but all of which provide some indication on how The Warrior's Way might perform.
More...
November 29th, 2010
As expected, Harry Potter and the Deathly Hallows: Part I led the way on the box office chart, but Tangled was stiffer competition than almost anyone thought it would be. Both were able to outperform the New Moon / The Blind Side one-two punch from last year. But the rest of the chart was not as strong, leading to three-day declines of 3% from last weekend and 6% from last year with $183 million. Over five days, the box office pulled in $264 million, which is again 3% lower than last year. 2010's lead over 2009 has been cut to 2% at $9.66 billion to $9.46 billion, which is not enough to assume 2010 will come out on top in the end, but it should be close.
More...
November 28th, 2010
A close battle for top spot at the box office led to a generally healthy Thanksgiving weekend, which looks set to be the second-biggest overall, behind last year's Twilight-dominated feast.
Harry Potter and the Deathly Hallows: Part I lays claim to the number one berth with a very solid $50.345 million estimate, according to Warner Bros., but Tangled is close behind with Disney putting its opening three day weekend at $49.1 million.
Tangled has posted better day-to-day numbers, particularly since Thanksgiving Day itself, and topped the chart on Saturday.
More...
November 24th, 2010
Its the Thanksgiving long weekend and the official start of the winter holiday blockbuster season. While there are four wide releases making their debut tonight, it will likely be a holdover, Harry Potter and the Deathly Hallows: Part I, that wins the box office race. Such was the case last year when New Moon repeated on top. It will be interesting to see whether or not Harry Potter will have stronger legs, whether or not the new releases get off to faster starts, and whether or not the overall box office is better.
More...
November 1st, 2010
November's here and expectations are all over the place. October saw 2010 lose ground to 2009, which is a bad sign going forward, but we also saw records fall. This month will undoubtedly see an increase in ticket sales over last month, what with the start of Awards Season and the Holidays, but the real question is how well it will compare with last year. Last November saw the release of a couple of surprise hits, none more surprising than The Blind Side, while in the end there were five $100 million movies and two that reached $200 million. Will that happen this year? Maybe. I count six films with a statistically significant shot at reaching $100 million, including three that might reach $200 million, and one of those has a shot at $300 million. That is on the high end, but even on the low end there are three $100 million movies coming out this month, including one that is all but guaranteed to reach $200 million in the end.
More...