Taika Waititi

Best known as a Director based on credits in that role in 12 films, with $1,756,958,456 worldwide aggregate box office (rank #93)
Best-known technical roles: Thor: Love and Thunder (Director), Thor: Love and Thunder (Screenwriter), Thor: Ragnarok (Director), Jojo Rabbit (Director), Jojo Rabbit (Screenwriter)
Best-known acting roles: Korg (Avengers: Endgame), Korg (Thor: Love and Thunder), Korg (Thor: Ragnarok), Mo Morrison (Lightyear), Antwan (Free Guy)
Most productive collaborators: Ryan Reynolds, Chris Evans, Shawn Levy, Chris Hemsworth, Matt Lieberman
Born: August 16, 1975 (48 years old)
                                    

  1. Summary
  2. News
  3. Acting Credits
  4. Technical Credits

Career Summary


  MoviesDomestic
Box Office
International
Box Office
Worldwide
Box Office
As an ActorSupporting7$1,530,222,458$2,879,611,581$4,409,834,039
Lead Ensemble Member2$376,627,736$471,178,418$847,806,154
Cameo1$55,817,425$111,280,312$167,097,737
Leading1$3,469,224$4,740,403$8,209,627
In Technical RolesDirector12$707,330,757$1,049,627,699$1,756,958,456
Screenwriter7$392,272,468$514,203,210$906,475,678
Producer4$48,759,427$88,126,777$136,886,204
Executive Producer3$0$589,295$589,295

Career Trend

This graph shows Taika Waititi’s score on our annual analysis of leading stars at the box office. The Star Score represents points assigned to each of the leading stars of the top 100 movies (based on box office) in the current year and two preceding years. For appearing in the number one movie in a year a star gets 100 points, the number two movie 99 points and so on..

Latest Ranking on Selected Box Office Record Lists


RecordRankAmount
Top 100 Stars in Leading Roles at the Domestic Box Office (Rank 601-700) 630 $380,096,960
Top Stars at the Domestic Box Office (Rank 301-400) 381 $1,966,136,843
Top 100 Stars in Leading Roles at the International Box Office (Rank 601-700) 660 $475,918,821
Top Below the Line Stars at the International Box Office 67 $2,680,178,406
Top Stars at the International Box Office (Rank 201-300) 254 $3,466,810,714
Top 100 Stars in Leading Roles at the Worldwide Box Office (Rank 601-700) 636 $856,015,781
Top Below the Line Stars at the Worldwide Box Office 75 $4,026,028,292
Top Stars at the Worldwide Box Office (Rank 201-300) 288 $5,432,947,557
Highest Grossing Stars of 2022 at the International Box Office 88 93
Highest Grossing Stars of 2024 at the International Box Office 100 93
Top Grossing Director at the Domestic Box Office (Rank 101-200) 107 $707,330,757
Top Grossing Producer at the Domestic Box Office (Rank 1,701-1,800) 1,770 $48,759,427
Top Grossing Screenwriter at the Domestic Box Office (Rank 201-300) 294 $392,272,468
Top Grossing Director at the International Box Office 97 $1,049,587,174
Top Grossing Executive Producer at the International Box Office (Rank 6,401-6,500) 6,401 $589,295
Top Grossing Producer at the International Box Office (Rank 1,301-1,400) 1,386 $88,086,252
Top Grossing Screenwriter at the International Box Office (Rank 301-400) 318 $514,162,685
Top Grossing Director at the Worldwide Box Office 93 $1,756,917,931
Top Grossing Executive Producer at the Worldwide Box Office (Rank 7,601-7,700) 7,670 $589,295
Top Grossing Producer at the Worldwide Box Office (Rank 1,501-1,600) 1,513 $136,845,679
Top Grossing Screenwriter at the Worldwide Box Office (Rank 201-300) 286 $906,435,153

See the Acting Credits tab for all Acting Box Office Records and the Technical Credits tab for all Technical Box Office Records.


Next Goal Wins trailer

November 20th, 2023

Taika Waititi’s soccer comedy drama, starring Michael Fassbender, Elisabeth Moss, and Will Arnett opened exclusively in theaters on Friday, November 17 ... Full Movie Details.

The American Samoa soccer team suffered the worst loss in World Cup history, losing to Australia 31-0 in 2001. With the 2014 World Cup approaching, the team recruits a down on his luck, maverick coach to help turn their fate around. More...

Weekend predictions: Songbirds & Snakes looking for mid-40s weekend

November 17th, 2023

The Hunger Games: The Ballad of Songbirds & Snakes

The Hunger Games: The Ballad of Songbirds & Snakes will land with an opening weekend somewhere in the mid-$40-millions, according to our model’s Friday run. While that’s well short of the debuts of previous films in the franchise, it’s a respectable number, and it’ll look very respectable if the final number comes in ahead of the $46.1 million earned by The Marvels last weekend. Technically, there’s a lot of competition from new releases this weekend, but those films neatly manage to avoid competing with one another, so in reality this could be a weekend when four new movies thrive. More...

Theater counts: The Marvels holds on as widest release despite a flurry of newcomers

November 16th, 2023

The Marvels

After a much lower than expected start for The Marvels last weekend, the latest Marvel film will remain the widest release this week, while four new wide releases make their way into theaters in time for the Thanksgiving Holiday. The Marvels will hold steady in 4,030 locations this week after collecting just over $46 million during its first three days. While an impressive haul by most standards, it posted the lowest earning opening weekend for an MCU film to date. More...

Home Market Releases for March 3rd, 2020

March 5th, 2020

Jojo Rabbit

It’s a terrible week on the home market with almost no prime new releases. In fact, if there weren’t a couple of late screeners to talk about and several secondary VOD titles, the main list would be very short. The week is so weak that Jojo Rabbit is really the only choice for Pick of the Week, even though it came out about a month ago. More...

2020 Awards Season: Oscars Winners and Reactions

February 10th, 2020

Parasite

The Oscars were handed out last night and unlike most years, I wasn’t able to live-blog the awards. This is a real shame, because it was one of the best Oscar nights I can remember and there were very few awards that made me legitimately angry, unlike many years in the past. There was even a surprise winner for the full night, as Parasite earned the most wins with four Oscars. It is incredibly rare for a foreign-language film to pull off that feat. More...

2020 Awards Season: Oscar Highlight: Best Adapted Screenplay

February 6th, 2020

Jojo Rabbit

Our annual Oscar Prediction contest is underway so now is the best time to look at the nominees and try and figure out who the favorites are and which films should just feel honored to be nominated. We are continuing our shortened schedule with Best Adapted Screenplay. We have yet another close race. True, there is a favorite, or to be more accurate, a close two-way race, but none of the nominees can really be called long shots. More...

2020 Awards Season: Oscar Nominations

January 13th, 2020

1917

The Oscar nominations were announced on Monday, and the results were... well, there were some puzzling results. Joker led the way with eleven nominations. ... A film with 69% positive reviews earned the most nominations. It’s not the worst-reviewed movie to earn a Best Picture Nomination—after all, Bohemian Rhapsody was nominated just last year. However, this film is arguably the worst-reviewed movie to ever earn the most nominations in a single year. More...

Jojo Rabbit Trailer

August 8th, 2019

Black comedy, written and directed by Taika Waititi opens October 18 ... Full Movie Details.

An awkward young German boy is being raised by a single mother, and his only ally is his imaginary friend Hitler. His naïve patriotism is tested when he meets a young girl who upends his world views, forcing him to face his biggest fears. More...

Featured Blu-ray and DVD Review: Avengers: Infinity War - Spoiler / Detail Free Review

August 14th, 2018

Avengers: Infinity War

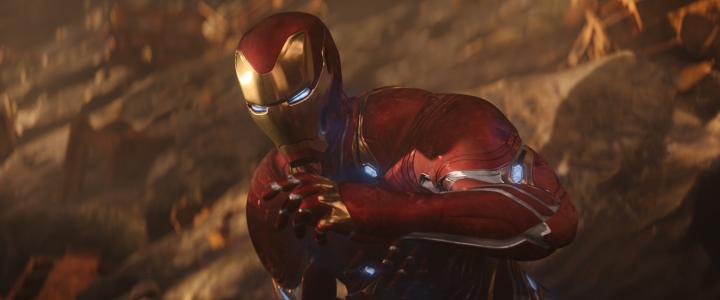
Like we did with The Force Awakens, we are going to do a spoiler-free, detail-free review for Avengers: Infinity War. In other words, we are going to rate all of the movies in the MCU to see where Infinity War and the rest fit into place. More...

Featured Blu-ray and DVD Review: Thor: Ragnarok

February 26th, 2018

Thor: Ragnarok

Thor: Ragnarok opened with some of the best reviews of the MCU and was easily the biggest hit in the Thor franchise. And now it is being completely overshadowed by Black Panther’s success. Is it worth checking out? Is it really one of the best films in the MCU? More...

2017 Preview: November

November 1st, 2017

Thor: Ragnarok

October wasn’t a good month; then again, outside of a few bright spots, the overall box office has been a disaster since early summer. I would love to say November will turn things around, but, while it should be better, in this case “better” is a relative term. There are two films on this list with a chance at $300 million, Thor: Ragnarok and Justice League, while Coco is nearly a guarantee for $200 million. By comparison, last November had a similar result with three films earning between $200 million and $300 million, but none topping that figure. This means, if Thor: Ragnarok and Justice League both get to that milestone, then 2017 could cut into 2016’s lead during the month. It will still take a minor miracle for 2017 to catch up in the end, but just cutting the lead in half by the end of December would be a reason to celebrate at this point. More...

2015 - Holiday Gift Guide - Part III - Limited Releases, Foreign Films, Classics, and Canadian Films

December 13th, 2015

The Collected Works of Hayao Miyazaki

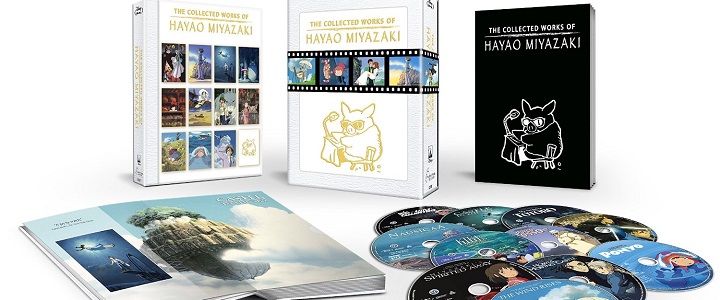
The third installment of the Holiday Gift Guide focuses on smaller releases, movies that opened in limited release, foreign films, classics getting new releases, and a few Canadian films. This year the list looks different to the previous guides for a simple reason. While there were only eight releases on the TV on DVD installment of the holiday gift guide, the first pass had more than 30 films on this list. I tried trimming the list, but that resulted in me remembering more films I wanted to add to it. Even after getting rid of the ones that won't be released until after Christmas, like Bone Tomahawk, there are still way too many releases to deal with. So let's not delay anymore and get to the list, starting with the biggest release... More...

Per Theater Chart: Shadow Steals Spotlight in Its Debut

February 18th, 2015

What We Do in the Shadows poster

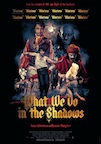
What We Do in the Shadows dominated the per theater chart earning an average of $41,778 in two theaters. This is high enough to suggest the film will be able to expand significantly. Additionally, its reviews are stunning, so its chances at box office success are even better. However, the comedy stylings of Jemaine Clement and Taika Waititi are not really mainstream and that might hurt its chances. The second place film on the per theater chart was the overall number one film, Fifty Shades of Grey, which earned an average of $23,360. The Last 5 Years was next with an average of $17,158 in three theaters. Gett: The Trial of Viviane Amsalem opened with an average of $12,105 in two theaters. Meanwhile, the second wide release of the week, Kingsman: The Secret Service, was the final film in the $10,000 club with an average of $11,300. More...

All Acting Credits


Register with The Numbers for free to customize this chart.

Release
Date
TitleRoleDomestic
Box Office
International
Box Office
Worldwide
Box Office
Jul 8, 2022Thor: Love and Thunder Korg $343,256,830$417,671,251$760,928,081
Jun 17, 2022Lightyear Mo Morrison $118,307,188$100,461,111$218,768,299
Aug 13, 2021Free Guy Antwan $121,626,598$201,847,194$323,473,792
Aug 5, 2021The Suicide Squad Ratcatcher $55,817,425$111,280,312$167,097,737
Mar 6, 2020Seven Stages to Achiev… Storsh
Oct 18, 2019Jojo Rabbit Adolf Hitler $33,370,906$53,507,167$86,878,073
Apr 26, 2019Avengers: Endgame Korg $858,373,000$1,930,539,285$2,788,912,285
Nov 3, 2017Thor: Ragnarok Korg $315,058,289$535,424,489$850,482,778
Feb 13, 2015What We Do in the Shadows Viago $3,469,224$4,740,403$8,209,627
Mar 2, 2012Boy Alamein $256,211$8,405,182$8,661,393
Jun 17, 2011Green Lantern Tom Kalmaku $116,601,172$102,934,320$219,535,492
 
Averages $196,613,684$346,681,071$543,294,756
Totals 11 $1,966,136,843$3,466,810,714$5,432,947,557


Leading or Lead Ensemble Roles


Register with The Numbers for free to customize this chart.

Release
Date
TitleOpening
Weekend
Maximum
Theaters
Domestic
Box Office
Worldwide
Box Office
Domestic
Share
Jul 8, 2022Thor: Love and Thunder $144,165,1074,375$343,256,830$760,928,08145.1%
Oct 18, 2019Jojo Rabbit $349,5551,173$33,370,906$86,878,07338.4%
Feb 13, 2015What We Do in the Shadows $83,555144$3,469,224$8,209,62742.3%
 
Averages $48,199,4061,897$126,698,987$285,338,59441.9%
Totals 3 $380,096,960$856,015,781


Supporting Roles


Register with The Numbers for free to customize this chart.

Release
Date
TitleOpening
Weekend
Maximum
Theaters
Domestic
Box Office
Worldwide
Box Office
Domestic
Share
Jun 17, 2022Lightyear $50,577,9614,255$118,307,188$218,768,29954.1%
Aug 13, 2021Free Guy $28,365,4164,165$121,626,598$323,473,79237.6%
Mar 6, 2020Seven Stages to Achiev…
Apr 26, 2019Avengers: Endgame $357,115,0074,662$858,373,000$2,788,912,28530.8%
Nov 3, 2017Thor: Ragnarok $122,744,9894,080$315,058,289$850,482,77837.0%
Mar 2, 2012Boy $21,24418$256,211$8,661,3933.0%
Jun 17, 2011Green Lantern $53,174,3033,816$116,601,172$219,535,49253.1%
 
Averages $101,999,8203,499$255,037,076$734,972,34035.9%
Totals 7 $1,530,222,458$4,409,834,039

Latest Ranking on All Acting Box Office Record Lists


RecordRankAmount
Top 100 Stars in Leading Roles at the Domestic Box Office (Rank 601-700) 630 $380,096,960
Top 100 Stars in Supporting Roles at the Domestic Box Office (Rank 201-300) 271 $1,530,222,458
Top Live Action Stars at the Domestic Box Office (Rank 301-400) 309 $1,792,012,230
Top Above the Line Stars at the Domestic Box Office (Rank 801-900) 839 $620,286,957
Top Below the Line Stars at the Domestic Box Office (Rank 101-200) 111 $1,345,849,886
Top Stars in Cameo Roles at the Domestic Box Office (Rank 701-800) 758 $55,817,425
Top Stars at the Domestic Box Office (Rank 301-400) 381 $1,966,136,843
Top 100 Stars in Leading Roles at the International Box Office (Rank 601-700) 660 $475,918,821
Top 100 Stars in Supporting Roles at the International Box Office (Rank 101-200) 174 $2,879,611,581
Top Live Action Stars at the International Box Office (Rank 101-200) 187 $3,255,069,291
Top Above the Line Stars at the International Box Office (Rank 801-900) 889 $786,632,308
Top Below the Line Stars at the International Box Office 67 $2,680,178,406
Top Stars in Cameo Roles at the International Box Office (Rank 401-500) 411 $111,280,312
Top Stars at the International Box Office (Rank 201-300) 254 $3,466,810,714
Top 100 Stars in Leading Roles at the Worldwide Box Office (Rank 601-700) 636 $856,015,781
Top 100 Stars in Supporting Roles at the Worldwide Box Office (Rank 101-200) 195 $4,409,834,039
Top Live Action Stars at the Worldwide Box Office (Rank 201-300) 219 $5,047,081,521
Top Above the Line Stars at the Wordwide Box Office (Rank 801-900) 865 $1,406,919,265
Top Below the Line Stars at the Worldwide Box Office 75 $4,026,028,292
Top Stars in Cameo Roles at the Worldwide Box Office (Rank 501-600) 554 $167,097,737
Top Stars at the Worldwide Box Office (Rank 201-300) 288 $5,432,947,557
Highest Grossing Stars of 2019 at the Domestic Box Office (Rank 501-600) 566 25
Highest Grossing Stars of 2020 at the Domestic Box Office (Rank 401-500) 491 25
Highest Grossing Stars of 2021 at the Domestic Box Office (Rank 401-500) 461 25
Highest Grossing Stars of 2022 at the Domestic Box Office (Rank 101-200) 124 93
Highest Grossing Stars of 2023 at the Domestic Box Office (Rank 101-200) 162 93
Highest Grossing Stars of 2024 at the Domestic Box Office (Rank 101-200) 136 93
Highest Grossing Stars of 2019 at the International Box Office (Rank 401-500) 495 13
Highest Grossing Stars of 2020 at the International Box Office (Rank 401-500) 462 13
Highest Grossing Stars of 2021 at the International Box Office (Rank 401-500) 442 13
Highest Grossing Stars of 2022 at the International Box Office 88 93
Highest Grossing Stars of 2023 at the International Box Office (Rank 101-200) 119 93
Highest Grossing Stars of 2024 at the International Box Office 100 93
Highest Grossing Stars of 2019 at the Worldwide Box Office (Rank 501-600) 540 17
Highest Grossing Stars of 2020 at the Worldwide Box Office (Rank 501-600) 512 17
Highest Grossing Stars of 2021 at the Worldwide Box Office (Rank 401-500) 480 17
Highest Grossing Stars of 2022 at the Worldwide Box Office (Rank 101-200) 102 93
Highest Grossing Stars of 2023 at the Worldwide Box Office (Rank 101-200) 138 93
Highest Grossing Stars of 2024 at the Worldwide Box Office (Rank 101-200) 114 93
Top Domestic Leading Stars for Original Screenplay Movies (Rank 1,701-1,800) 1,716 $33,370,906
Top Domestic Leading Stars for Based on Comic/Graphic Novel Movies (Rank 101-200) 113 $343,256,830
Top Domestic Leading Stars for Based on Short Film Movies 84 $3,469,224
Top International Leading Stars for Original Screenplay Movies (Rank 1,301-1,400) 1,331 $53,507,167
Top International Leading Stars for Based on Comic/Graphic Novel Movies (Rank 101-200) 143 $417,671,251
Top International Leading Stars for Based on Short Film Movies 68 $4,740,403
Top Worldwide Leading Stars for Original Screenplay Movies (Rank 1,401-1,500) 1,483 $86,878,073
Top Worldwide Leading Stars for Based on Comic/Graphic Novel Movies (Rank 101-200) 136 $760,928,081
Top Worldwide Leading Stars for Based on Short Film Movies 85 $8,209,627
Top Domestic Leading Stars for Live Action Movies (Rank 2,201-2,300) 2,264 $36,840,130
Top Domestic Leading Stars for Animation/Live Action Movies (Rank 101-200) 168 $343,256,830
Top International Leading Stars for Live Action Movies (Rank 1,601-1,700) 1,640 $58,247,570
Top International Leading Stars for Animation/Live Action Movies (Rank 201-300) 216 $417,671,251
Top Worldwide Leading Stars for Live Action Movies (Rank 1,801-1,900) 1,885 $95,087,700
Top Worldwide Leading Stars for Animation/Live Action Movies (Rank 101-200) 200 $760,928,081
Top Domestic Leading Stars for Historical Fiction Movies (Rank 501-600) 533 $33,370,906
Top Domestic Leading Stars for Super Hero Movies (Rank 101-200) 109 $343,256,830
Top Domestic Leading Stars for Fantasy Movies (Rank 701-800) 715 $3,469,224
Top International Leading Stars for Historical Fiction Movies (Rank 401-500) 422 $53,507,167
Top International Leading Stars for Super Hero Movies (Rank 101-200) 134 $417,671,251
Top International Leading Stars for Fantasy Movies (Rank 601-700) 655 $4,740,403
Top Worldwide Leading Stars for Historical Fiction Movies (Rank 401-500) 465 $86,878,073
Top Worldwide Leading Stars for Super Hero Movies (Rank 101-200) 126 $760,928,081
Top Worldwide Leading Stars for Fantasy Movies (Rank 701-800) 789 $8,209,627
Top Domestic Leading Stars for Action Movies (Rank 101-200) 186 $343,256,830
Top Domestic Leading Stars for Comedy Movies (Rank 1,601-1,700) 1,675 $3,469,224
Top Domestic Leading Stars for Black Comedy Movies (Rank 101-200) 162 $33,370,906
Top International Leading Stars for Action Movies (Rank 201-300) 265 $417,671,251
Top International Leading Stars for Comedy Movies (Rank 1,101-1,200) 1,103 $4,740,403
Top International Leading Stars for Black Comedy Movies 54 $53,507,167
Top Worldwide Leading Stars for Action Movies (Rank 201-300) 225 $760,928,081
Top Worldwide Leading Stars for Comedy Movies (Rank 1,601-1,700) 1,691 $8,209,627
Top Worldwide Leading Stars for Black Comedy Movies 98 $86,878,073
Top Domestic Leading Stars for PG-13 Movies (Rank 301-400) 333 $376,627,736
Top Domestic Leading Stars for R Movies (Rank 2,101-2,200) 2,166 $3,469,224
Top International Leading Stars for PG-13 Movies (Rank 301-400) 360 $471,178,418
Top International Leading Stars for R Movies (Rank 1,801-1,900) 1,834 $4,740,403
Top Worldwide Leading Stars for PG-13 Movies (Rank 301-400) 351 $847,806,154
Top Worldwide Leading Stars for R Movies (Rank 2,201-2,300) 2,231 $8,209,627
Top Domestic Leading Stars for Walt Disney Movies (Rank 101-200) 192 $343,256,830
Top International Leading Stars for Walt Disney Movies (Rank 201-300) 208 $417,671,251
Top Worldwide Leading Stars for Walt Disney Movies (Rank 201-300) 202 $760,928,081

All Technical Credits


Register with The Numbers for free to customize this chart.

Release
Date
TitleRoleDomestic
Box Office
International
Box Office
Worldwide
Box Office
May 22, 2026Untitled Star Wars Movie Director
Co-writer
Nov 24, 2023Frybread Face and Me Executive Producer
Nov 17, 2023Next Goal Wins Director
Screenwriter
Producer
$6,713,826$11,183,836$17,897,662
Jul 8, 2022Thor: Love and Thunder Director
Screenwriter
$343,256,830$417,671,251$760,928,081
Nov 12, 2021Night Raiders Executive Producer $22,737$22,737
Jan 22, 2021Baby Done Executive Producer $566,558$566,558
Oct 18, 2019Jojo Rabbit Director
Screenwriter
Producer
$33,370,906$53,507,167$86,878,073
Nov 3, 2017Thor: Ragnarok Director $315,058,289$535,424,489$850,482,778
Jun 24, 2016Hunt for the Wilderpeople Director
Screenwriter
Producer
$5,205,471$18,695,371$23,900,842
Feb 13, 2015What We Do in the Shadows Director
Screenwriter
Producer
$3,469,224$4,740,403$8,209,627
Mar 2, 2012Boy Director
Screenwriter
$256,211$8,405,182$8,661,393
 
Averages $101,047,251$116,690,777$195,283,083
Totals 11 $707,330,757$1,050,216,994$1,757,547,751


Director Credits


Register with The Numbers for free to customize this chart.

Release
Date
TitleOpening
Weekend
Maximum
Theaters
Domestic
Box Office
Worldwide
Box Office
Domestic
Share
May 22, 2026Untitled Star Wars Movie
Nov 17, 2023Next Goal Wins $2,500,2952,240$6,713,826$17,897,66237.5%
Jul 8, 2022Thor: Love and Thunder $144,165,1074,375$343,256,830$760,928,08145.1%
Oct 18, 2019Jojo Rabbit $349,5551,173$33,370,906$86,878,07338.4%
Nov 3, 2017Thor: Ragnarok $122,744,9894,080$315,058,289$850,482,77837.0%
Jun 24, 2016Hunt for the Wilderpeople $78,439200$5,205,471$23,900,84221.8%
Feb 13, 2015What We Do in the Shadows $83,555144$3,469,224$8,209,62742.3%
Mar 2, 2012Boy $21,24418$256,211$8,661,3933.0%
 
Averages $38,563,3121,747$101,047,251$250,994,06532.2%
Totals 8 $707,330,757$1,756,958,456


Producer Credits


Register with The Numbers for free to customize this chart.

Release
Date
TitleOpening
Weekend
Maximum
Theaters
Domestic
Box Office
Worldwide
Box Office
Domestic
Share
Nov 17, 2023Next Goal Wins $2,500,2952,240$6,713,826$17,897,66237.5%
Oct 18, 2019Jojo Rabbit $349,5551,173$33,370,906$86,878,07338.4%
Jun 24, 2016Hunt for the Wilderpeople $78,439200$5,205,471$23,900,84221.8%
Feb 13, 2015What We Do in the Shadows $83,555144$3,469,224$8,209,62742.3%
 
Averages $752,961939$12,189,857$34,221,55135.0%
Totals 4 $48,759,427$136,886,204


Writer Credits


Register with The Numbers for free to customize this chart.

Release
Date
TitleOpening
Weekend
Maximum
Theaters
Domestic
Box Office
Worldwide
Box Office
Domestic
Share
May 22, 2026Untitled Star Wars Movie
Nov 17, 2023Next Goal Wins $2,500,2952,240$6,713,826$17,897,66237.5%
Jul 8, 2022Thor: Love and Thunder $144,165,1074,375$343,256,830$760,928,08145.1%
Oct 18, 2019Jojo Rabbit $349,5551,173$33,370,906$86,878,07338.4%
Jun 24, 2016Hunt for the Wilderpeople $78,439200$5,205,471$23,900,84221.8%
Feb 13, 2015What We Do in the Shadows $83,555144$3,469,224$8,209,62742.3%
Mar 2, 2012Boy $21,24418$256,211$8,661,3933.0%
 
Averages $24,533,0331,358$65,378,745$151,079,28031.3%
Totals 7 $392,272,468$906,475,678