June 12th, 2018
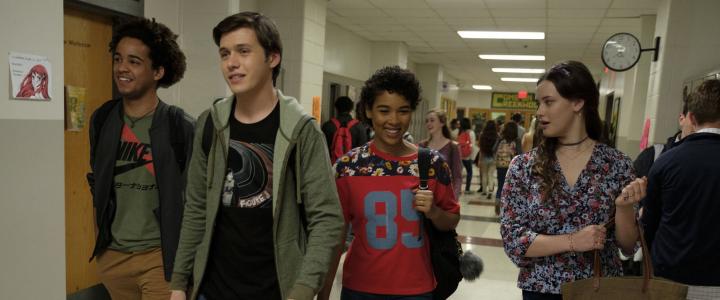
There are not many big releases on this week’s list. Tomb Raider, Sherlock Gnomes, The Strangers: Prey at Night, and Love, Simon were, at best, midlevel hits domestically. Worse still, only the last one earned good reviews. Fortunately, the film is good enough that the DVD, Blu-ray Combo Pack, or 4K Ultra HD Combo Pack is worthy as Pick of the Week.
More...
April 18th, 2018
-6-News.jpg)
Rampage dominated the international box office earning more than the rest of the top ten combined with $115.7 million on 40,200 screens in 61 markets for a worldwide opening weekend of $151.5 million. The film’s biggest opening was in China, where it managed $54.88 million on 21,500 screens over the weekend for a total opening of $55.56 million. This is a good result, compared to recent results. It’s better than Tomb Raider managed, but not as good as Ready Player One, for example. The U.K. and South Korea were in a close race for second place with the former earning $5.8 million on 883 screens and the latter earning $4.99 million on 909 screens over the weekend for a total opening of $5.60 million.
More...
April 15th, 2018
-4-News.jpg)
Rampage isn’t exactly living up to its name this weekend, as it heads for a $34.5 million debut—just enough to keep A Quiet Place in second place, with $32.6 million in its second outing (down a very respectable 35% from its debut). As might be expected, international markets are proving friendlier to Rampage than the US and Canada, and it’s off to a healthy $114.1 million start in 61 territories, according to Warner Bros.’ Sunday morning estimate.
More...
April 12th, 2018
-1-News.jpg)
Rampage is the biggest new release of the week and at one time it was widely assumed it would be the biggest hit of the month. Granted, this changed the second Infinity War moved up to an April release. However, now the film likely won’t even be the second biggest hit of the month, as A Quiet Place dominated last weekend. Truth or Dare has to deal with direct competition and that’s going to kill it. Finally, Isle of Dogs is expanding semi-wide. It likely won’t reach the top five, but it is already doing well for a limited release. This weekend last year, The Fate of the Furious opened with nearly $100 million. That’s about what the top four will earn this year. I can’t imagine 2018 coming ahead in the year-over-year comparison.
More...
April 4th, 2018

Ready Player One opened in first place on the international chart with $127.5 million on 35,600 screens in 62 markets. Its biggest single market was China with $61.61 million on 18,200 screens over the weekend for a total opening of $62.06 million. This is Warner Bros.’ biggest opening ever in this market. The film’s second biggest international market of the weekend was South Korea, where it earned second place with $6.35 million on 1,079 screens for a total opening of $8.08 million. The film also had to settle for second place behind Peter Rabbit in the U.K. with $7.3 million on 1,251 screens. The film did open in first place in several other major markets, including France ($6.15 million on 719 screens) and Russia ($5.74 million on 1,461).
More...
March 28th, 2018

Pacific Rim: Uprising easily earned first place on the international chart with $122.4 million in 61 markets during its opening weekend. The film earned first place in China with $63.80 million over the weekend for a total opening of $65.19 million including previews. There were two markets who could claim second place: Russia and South Korea. In Russia, the film earned $6.76 million on 1,538 screens. Meanwhile in South Korea, it opened with $5.27 million on 1,143 screens over the weekend for a total opening of $6.80 million.
More...
March 27th, 2018

Pacific Rim: Uprising opened in first place over the weekend. In fact, it opened better than expected with $28.12 million. Unfortunately, that’s nowhere near enough compared to its production budget, so it will need international numbers to thrive. Black Panther was finally removed from top spot, but it also held on better than expected with $17.10 million. As for the rest of the new releases, they ranged from serious disappointments like Sherlock Gnomes and Paul, Apostle of Christ, to complete bombs like Midnight Sun and Unsane. The overall box office slipped just 2.0% from last week earning $129 million. However, this is 36% lower than the same weekend last year. 2018’s lead has completely evaporated and it is now $60 million or $2.1% behind 2017’s pace at $2.64 billion to $2.69 billion. I don’t see that improving this coming weekend.
More...
March 25th, 2018

Black Panther’s run at the top of the domestic chart will finally come to an end this weekend, with Pacific Rim: Uprising taking over as the most popular film in the US and Canada. The switch over is mostly due to Panther beginning to run out of steam, rather than Uprising showing any particular strength though. Universal’s sci-fi action movie will pick up $28.005 million over its opening weekend in North America, about in line with expectations, but disappointing for a film that cost $150 million to make. Overseas markets, particularly in Asia, are where the box office action is at for this one.
More...
March 23rd, 2018

Pacific Rim: Uprising got off to an okay start with $2.35 million from Thursday previews. Given its reviews and the recent results of films like Tomb Raider and last year’s Power Rangers that puts the film’s projected weekend haul at $26 million. That’s a little higher than we predicted, but close enough to call it a victory.
More...
March 22nd, 2018

Black Panther will finally give up its hold on first place, that is unless something goes horribly wrong for Pacific Rim: Uprising. There are four other wide or semi-wide releases hitting theaters this weekend, which is at least two too many. Sherlock Gnomes and Paul, Apostle of Christ are the only two that have a legitimate shot at the top five. Meanwhile, Midnight Sun and Unsane are just hoping to not miss the top ten. This weekend last year, there were three wide releases that earned a combined $60 million. This is more than the five wide releases this year will earn. Also, Beauty and the Beast remained in second place with $90 million. 2018 has already lost its lead over 2017 and this weekend it is going to get crushed in the year-over-year comparison.
More...
March 21st, 2018
-2-News.jpg)
Tomb Raider roared into first place on the international chart earning $87.2 million on 33,290 screens in 65 markets for an early total of $105.2 million. The film’s biggest single market was China, where it opened in first place with $40.79 million on 15,640 screens over the weekend for a total opening of $41.26 million. The film’s second best opening was in the U.K. at $4.29 million in 585 theaters. The only other market where the film opened with more than $4 million was Russia with $4.11 million on 1,457 screens. The film debuted in first place in all three markets and is in a good position to break even early in its home market run.
More...
March 20th, 2018

As predicted, Black Panther remained in first place on the weekend chart. Tomb Raider had an okay opening in second place, while I Can Only Imagine was the biggest positive surprise of the weekend. Love, Simon had a solid opening, especially compared to its production budget. The less said about 7 Days in Entebbe, the better. Overall, the weekend box office was down 4.8% from last weekend to just $132 million. This is 49% lower than this weekend last year. A 49% decline usually only happens when there is a misalignment in holidays, but in this case it’s due to Beauty and the Beast’s debut. 2018 is still ahead of 2017, albeit by a fraction of last week’s lead at just $66 million or 2.8%. In fact, with a margin of just $2.46 billion to $2.39 billion, it is very likely 2018 will lose its lead before the next weekend begins.
More...
March 18th, 2018

A spirited opening by Tomb Raider won’t be quite enough to knock Black Panther off its perch at the top of the domestic box office chart this weekend. The final numbers will be close: Raider is predicted to earn $23.52 million by Warner Bros., while Disney has Panther coming in with $27.024 million. If the numbers hold (and it would be a huge surprise if they don’t), Black Panther will become the first film since Avatar to spend its first five weekends at the top of the chart.
More...
March 17th, 2018
-1-News.jpg)
As expected, Tomb Raider opened in first place with $9.06 million on Friday. However, this won’t be enough to stay ahead of Black Panther for long. Its reviews are nearly 50% positive, while it earned just a B from CinemaScore. A $23 million to $24 million opening isn’t a bad start for this time of year, but it is far from impressive for a film that reportedly cost between $90 million and $106 million.
More...
March 16th, 2018
Tomb Raider started its box office run with $2.1 million during its midnight showings. This is almost exactly what the film needed to earn to match our prediction. In fact, it might be a little on the high side. The film’s reviews are, according to Rotten Tomatoes, the best for a video game adaptation of all time, at least for films that got a theatrical release here. If the film can top $25 million over the weekend, then the studio will be mostly happy. They can’t be completely blown away, as the film reportedly cost $90 million to make and it likely won’t have great legs, due to the Fanboy Effect.
More...
March 15th, 2018
Another week and another film trying to dethrone Black Panther. This week, it’s Tomb Raider’s chance to finally remove Black Panther from first place on the weekend chart. I don’t like its chances. The only other truly wide release of the week is Love, Simon, which should have a solid, but not spectacular opening. There are two other films with a shot at earning a spot in the top ten: I Can Only Imagine and 7 Days in Entebbe. This weekend last year, Beauty and the Beast opened with nearly $175 million. That’s more than the entire box office is going to earn this weekend. 2018 is going to get crushed.
More...
March 14th, 2018
For the first time, Black Panther earned first place on the international chart, adding $100.0 million in 57 markets to its totals, which now sit at $516,600,000 internationally and $1.078 billion worldwide. It became just the 33rd film to reach $1 billion worldwide and by Tuesday was in the top 20 of all time. Additionally, it is now in fifth place in the MCU and will be in a close fight for third place by the end of the weekend. I’m more bullish that I was last weekend, because the film was a hit in China earning $65.07 million. This is about on par with Thor: Ragnarok and Spider-Man: Homecoming, meaning the film is on pace to hit $1.3 billion worldwide
More...
March 1st, 2018

February was an amazing month, thanks mainly to Black Panther, but Fifty Shades Freed and Peter Rabbit were also significant hits and overall the month was a massive improvement over last February. Looking forward, there’s nothing opening in March that will earn as much in total as Black Panther did during its opening weekend. That said, A Wrinkle in Time and Ready Player One should have no trouble getting to $100 million, while Tomb Raider has a 50/50 chance of getting there. Unfortunately, compared to last March, this is still a pittance. There’s a chance that no film opening this March will earn as much in total as Beauty and the Beast opened with last march. We will need Black Panther to have good legs to keep 2018 ahead of 2017 by the end of the month.
More...
January 19th, 2018
Action movie starring starring Alicia Vikander opens March 16 ... Full Movie Details.
More...
.jpg)