April 10th, 2022
-2-News.jpg)
Sonic the Hedgehog 2 is having a rip-roaring start to its theatrical run this weekend, with Paramount Pictures projecting a $71 million opening on Sunday morning, easily topping the $58 million earned by Sonic the Hedgehog when it debuted in early 2020. With Everything Everywhere All at Once also posting excellent numbers as it expands into wide release, and Ambulance holding its own on its first weekend, we’re headed to the second-best weekend of the box office this year.
More...
February 15th, 2018
-2-News.jpg)
With our annual Oscar Prediction contest underway, now is the best time to look at the nominees and try to figure out who the favorites are and which films should just feel honored to be nominated. A lot of people call this Oscar the Pixar Award, and look at that, there’s a Pixar film on this list. Is Coco the overwhelming favorite? Or does another film have what it takes?
More...
January 5th, 2018
-2-News.jpg)
The Producers Guild of America finally finished announcing their nominations. (They spread out their announcements for reasons I’ve never quite understood.) It is a strange year for the PGAs, as there was a tie resulting in 11 films being nominated for the top prize.
More...
December 5th, 2017

The week is deceptively strong. At first glance, Despicable Me 3 appears to have scared off all of the competition, but when you look deeper, there are a lot of contenders for Pick of the Week. These include Twin Peaks: A Limited Event Series, Better Watch Out, Princess Cyd, and others. In the end, I went with Long Time Running, which came out on DVD and Blu-ray last Friday.
More...
December 3rd, 2017
Despicable Me 3 is the fourth film in the Despicable Me franchise. I’ve previously reviewed the first three films and bought the first film, because I loved it. The second film was weaker, but still great. The third film was Minions. It’s a kids movie, nothing more. There’s been a downward trajectory in the quality that’s quite noticeable. Does it continue here? Is it at least better than Minions was?
More...
November 20th, 2017
-2-News.jpg)
It is a slow week on the home market for two reasons. Technically it is one reason, but it is having two effects. It’s Thanksgiving weekend, which means the schedule is really busy and I need to keep this list short in order to save time. Also, while Thanksgiving means Black Friday and Cyber Monday, two of the busiest shopping days of the year, you don’t want to release something new into that storm of chaos. The biggest release of the week, not counting VOD releases is The Hitman’s Bodyguard, which I reviewed. As for the best release on this week’s list, I’m torn between Good Time, NEW GAME: The Complete First Season, and The Villainess. It was down to a roll of the dice, but The Villainess on Blu-ray Combo Pack is the Pick of the Week.
More...
October 12th, 2017
-1-News.jpg)
Never Say Die rose to first place with $67 million over the weekend for a two-week total of $223 internationally. The film added $66.28 million to its running tally in its native China, which now sits at $222.75 million after nine days of release. The film is on track to top Kung Fu Yoga as the biggest comedy hit in China. In fact, it is on pace to top Meet the Fockers as the biggest Comedy hit in any one single market.
More...
October 4th, 2017

Kingsman: The Golden Circle remained in first place on the international chart with $50.5 million in 77 markets for totals of $125.97 million internationally and $192.61 million worldwide. The film dominated the South Korean market with $11.89 million on 1,677 screens over the weekend for a total opening of $16.49 million there. It also debuted in first place in Mexico, with a less impressive $2.28 million. The film has yet to open in France, China, and Japan, so it should continue to rake in the money.
More...
September 28th, 2017

Kingsman: The Golden Circle made its international debut and it was mostly really good news, as it topped the chart with $61.18 million on 11,623 screens in 64 markets. Its biggest market was the U.K., where it earned $11.40 million on 602 screens. This is a massive improvement over the $6.4 million its predecessor opened with. Likewise, this film earned $6.01 million on 1300 screens in Russia, up from $3.5 million for the first film. It wasn’t able to grow that much in Australia, but it did increase its haul to $4.56 million on 405 screens, up from $3.22 million on 372 for the original film. The film has yet to open in France, South Korea, China, and Japan, so this is a great start. It very likely won’t have the same legs, but even so, $400 million worldwide is a solid milestone to aim for, given this start.
More...
September 21st, 2017
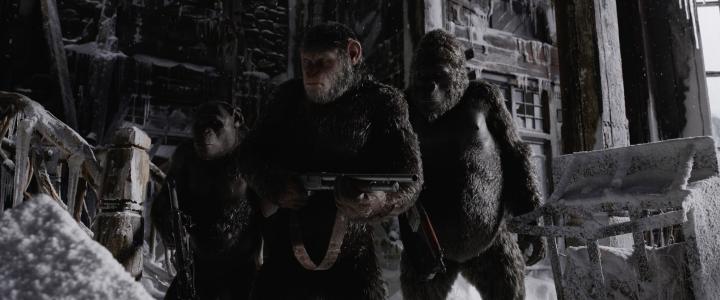
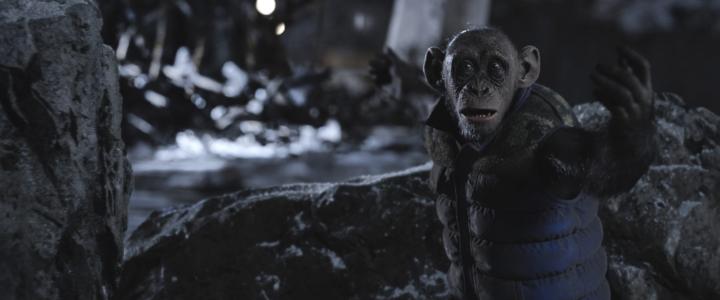
War for the Planet of the Apes returned to the top of the chart earning $62.9 million in 21 markets for totals of $287.9 million internationally and $433.8 worldwide. The film debuted in first place in China with $59.66 million over the weekend for a total opening of $61.07 million.
More...
September 14th, 2017

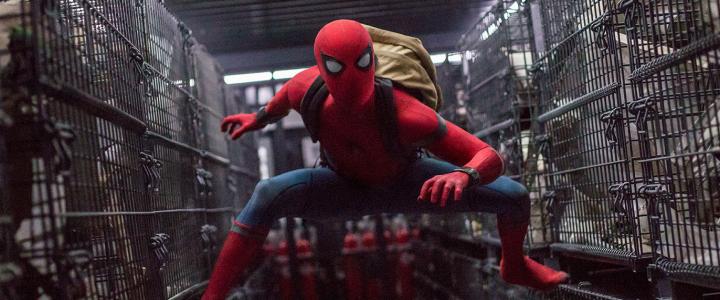
Spider-Man: Homecoming returned to the international top five earning first place with $71.82 million on 21,675 screens in 47 markets for totals of $495.74 million internationally and $823.43 million worldwide. The film debuted in first place in China with $69.12 million on 20,440 screens over the weekend for a four-day opening of $70.63 million. This is already the biggest single market for the film, overtaking South Korea, where it has earned $51.51 million. At this point, the film will have no trouble getting to $900 million worldwide, but $1 billion is out of reach.
More...
September 7th, 2017

Dunkirk returned to the international top five for the first time in nearly a month with $36.5 million in 60 markets for totals of $280.0 million international and $459.0 million worldwide. Nearly all of this came from its first place opening in China, where it pulled in $29.80 million over the weekend for a four-day opening of $30.27 million. The film also opened in Italy, but had to settle for second place with $3.6 million on 606 screens. Dunkirk wraps up its international run in Japan this weekend and will finish with north of $500 million worldwide. Unless it cost an obscene amount to advertise, this will be enough to ensure profitability by its initial push into the home market.
More...
September 3rd, 2017

This weekend is somewhat uncharted territory for the movie industry, with no new releases rolling out in over 1,000 theaters and no dominant film already playing. Fortunately, the result is looking like a glass that is at least half full. Thanks in part to the holiday weekend, and the start of recovery from Hurricane Harvey, several returning films improved their box office from last weekend, and the number one film, The Hitman’s Bodyguard, will remain flat from its last outing, with $10.25 million expected by Lionsgate, and a total around $55 million by the end of the day on Sunday.
More...
August 10th, 2017
-2-News.jpg)
Wolf Warriors 2 remained in top spot on the international chart with $164 million at the weekend. This is dominated by a sophomore stint of $163.38 million in its native China for a two-week total of $471.94 million. It is already the biggest hit in China, crushing The Mermaid, at least in terms of local currency. It still has a ways to go to become the number one film in terms of the US dollar, but it should get there shortly.
More...
August 5th, 2017

On the positive side, The Dark Tower topped the chart on Friday. On the negative side, it missed both our original prediction, as well as our lowered expectations with just $7.725 million. The film’s reviews are terrible at 19% positive, while its CinemaScore is a mere B, so that’s bad news for the film’s legs, putting it on pace for between $18 million and $19 million. It’s good news for Dunkirk, which has a real shot at first place on the weekend chart for the third weekend in a row.
More...
August 3rd, 2017

August has begun, but I’m starting to think Summer has already ended. The Dark Tower was expected to be the big hit of the weekend, but its reviews are a lot weaker than anticipated. Kidnap is also opening wide and its early reviews were good, but that has changed as the day has gone on. Furthermore, it’s buzz is really quiet, so its box office chances are not good. Finally Detroit is expanding wide this weekend. Its reviews are among the best we’ve seen all summer, but it is tough to go from a limited release to a wide release, so I’m not overly optimistic. This weekend last year, Suicide Squad opened with $133.68 million. It is very likely the entire box office will be less than $133.68 million this weekend. 2017 is going to get destroyed in the year-over-year comparison.
More...
August 3rd, 2017
-1-News.jpg)
Wolf Warriors 2 dominated the international box office with $132.88 million over the weekend in its native China, for a four-day opening of $148.10 million. This is more than the rest of the top five earned combined.
More...
July 28th, 2017

Atomic Blonde easily topped The Emoji Movie during previews, earning $1.52 million. However, had the action flick not topped the family film, it would have been a disaster. Compared to other recent action films, Atomic Blonde underperformed Valerian and the City of a Thousand Planets ($1.7 million) and Baby Driver ($2.1 million), but at least it topped King Arthur: Legend of the Sword ($1.15 million). This summer, the average action film has opened with just over 10 times what it made during its previews, which is bad news for Atomic Blonde, as it puts the film’s opening weekend at $15 million to $16 million. Its reviews are good, but not great enough to really change this trend. Even $20 million would be a boon after this start.
More...
July 27th, 2017

The final weekend of July has two wide releases, Atomic Blonde and The Emoji Movie. Neither are expected to be monster hits, but both could be profitable at the box office. Atomic Blonde’s reviews are excellent and its connections to the John Wick movies could get people into theaters. The Emoji Movie still has no reviews and its buzz is incredibly negative. I haven’t seen buzz this negative since Diary of a Wimpy Kid: The Long Haul. This does give Dunkirk a real shot at repeating on top of the chart. This weekend last year, Jason Bourne opened with nearly $60 million, which will likely be more than both new releases this year earn. Even if Dunkirk has better legs than expected, there’s little hope 2017 will win in the year-over-year comparison.
More...
July 27th, 2017
Dunkirk debuted in first place on the international chart with $55.4 million in 46 markets for a worldwide debut of $105.9 million. Its biggest opening was in the U.K., no surprise there, where it earned $13.00 million in 638 theaters. Strangely, South Korea wasn’t far behind with $8.75 million on 1,245 screens over the weekend for a total opening of $10.40 million. On the other hand, the film struggled somewhat in France with $4.9 million. This isn’t a bad opening, but I was expecting more. Overall, it is doing about as well as Christopher Nolan’s previous film, Interstellar. If Dunkirk can merely match that movie's worldwide figure, then it will break even before it reaches the home market. Even if it doesn’t quite manage that total, anything above $500 million worldwide will produce a healthy profit for the studio.
More...
July 19th, 2017

I thought last week was close, but this week was even closer. In fact, according to Sunday’s estimates, Spider-Man: Homecoming was the top film on the international chart, but Monday’s final numbers had Despicable Me 3 in first place. That film earned $72.7 million in 61 markets for totals of $434.00 million internationally and $622.39 million worldwide. Its biggest opening came in Indonesia, where it earned $3.5 million on 230 screens. Meanwhile, the film is now the second biggest animated film at the Chinese box office. This past weekend, Despicable Me 3 earned $22.09 million on 8,057 screens for a two-week total of $115.16 million. The film opens in Japan and South Korea before the end of the month, as well as Italy and a few other smaller markets by the end of August.
More...
July 18th, 2017
The weekend box office chart didn’t hold a lot of surprises. War for the Planet of the Apes earned first place with a slightly better than predicted result of $56.26 million, while most of the rest of our predictions were also close enough to be considered victories. Overall, the box office plummeted 21% from last weekend reaching $163 million. This was also a little lower than the same weekend last year. The emphasis is on “little”, as it only dropped by 0.062% or about $100,000. On its own, this would be nothing to worry about. However, 2017’s lead over 2016 has completely evaporated and the year is now 0.19% or $12 million behind last year’s pace at $6.21 billion to $6.22 billion. We’ve lost about $200 million this summer compared to last year and I don’t see that turning around any time soon.
More...
July 15th, 2017
As expected, War for the Planet of the Apes earned first place on Friday. To match predictions, the film needed to make between $18 million and $19 million, but instead it earned $22.1 million during its first day of release. Furthermore, this is better than its previews were, so this suggests good word-of-mouth and longer than average legs. Its reviews are 94% positive and it earned a solid A from CinemaScore, so long legs wouldn’t be a shock. Perhaps it can reach $60 million over the weekend. Anything less than $55 million will be a little disappointing. Splitting the difference gets us a weekend target of $57 million.
More...
July 13th, 2017
War for the Planet of the Apes is going to be the biggest of the three wide releases coming out this week. This much is a near certainty. However, there is some doubt if it will open in first place, or if Spider-Man: Homecoming will remain the top draw over the weekend. The only other wide release of the week is Wish Upon, a low-budget horror film, if it can just reach the top five, then the studio will be very happy. Finally, The Big Sick is expanding wide. Given its limited release run so far, it should become a sleeper hit over the summer. This weekend last year, The Secret Life of Pets and Ghostbusters had a one-two punch of nearly $100 million. I think War for the Planet of the Apes and Spider-Man: Homecoming will top that figure, while the overall depth should help 2017 win in the year-over-year competition, but it will likely be close.
More...
July 13th, 2017

Spider-Man: Homecoming earned first place in one of the closest races I’ve seen. It pulled in $140.03 million on 24,287 screens in 71 markets for a worldwide opening of $257.06 million. Its biggest market was South Korea, where it earned $19.37 million on 1,965 screens over the weekend for a total opening of $25.94 million. It also cracked $10 million in both the U.K. ($12.11 million in 616 theaters) and Mexico ($11.72 million on 3,506 screens), while it came close to that mark in Brazil with $9.09 million on 1,302 screens. The film did amazing business in Asia, including earning $6.84 million on 1,092 screens in Indonesia and $6.46 million on 1,900 screens in India. The film has yet to open in a number of major markets, including France, Germany, China, and Japan and should top $800 million worldwide with ease before it is done, which is enough to break even before it reaches the home market. The real challenge is surpassing Wonder Woman and Guardians of the Galaxy Vol 2 for top spot on the worldwide chart for the summer. It is too soon to tell if it will get there for sure, but this is a great start.
More...
July 11th, 2017
The weekend box office chart held few surprises. Every film in the top five was close to our predictions, while the top two films were a little stronger. This includes Spider-Man: Homecoming, which pulled in $117.03 million during its opening weekend, making it the second fastest debut of the summer. (Only Guardians of the Galaxy Vol 2 is ahead of it in that regard.) Despicable Me 3 held on better than most films this summer and will become a monster hit thanks to its international numbers. Overall, the box office rose by 22% from last weekend hitting $206 million. Unfortunately, this is still 5.1% lower than the same weekend last year. Before the summer began, 2017 had a $200 million lead over 2006. That lead is now down to just $13 million at $5.95 billion to $5.94 billion. This lead could be completely gone by the weekend.
More...
July 9th, 2017
A $117 million opening weekend is pretty much all Sony could ask for from Spider-Man: Homecoming. It’s the second-best debut for the Spider-Man franchise, if you ignore the effects of inflation, and makes it almost certain that the franchise will break its unfortunate streak of earning less at the domestic box office with every new outing. With, reportedly, a more constrained budget—this is the least expensive Spider-Man film, adjusted for inflation—profitability looks assured, and Sony’s partnership with Disney looks as though it’s paying off.
More...
July 8th, 2017

Spider-Man: Homecoming dominated the box office on Friday and in a pleasant surprise, it beat predictions with $50.5 million during its opening day. Its opening day vs. its previews is almost identical to Guardians of the Galaxy Vol 2, which would put the film on pace for $130 million over the weekend. Spider-Man: Homecoming did earn better reviews, while both movies earned a solid A from CinemaScore, and many more kids have no school on Monday compared to when Guardians debuted. All of this should help its legs. On the other hand, Homecoming could have a bigger Fanboy Effect, as Spider-Man is a much more established character. Because of that, I’m going to be a little more cautious and predict a $125 million opening weekend. This is still simply fantastic and the only downside is Sony and Disney have to work together to make this work in the long term. This is Sony’s second best domestic opening of all time. (Spider-Man 3 is the only one that beats it.) It could open with more than last year’s number one domestic hit for the studio, Ghostbusters, earned in total. Sony has a lot of reasons to work with Disney to keep Spider-Man in the MCU.
More...
July 6th, 2017
Spider-Man: Homecoming is the only film opened wide this weekend and that should help it dominate the box office. In fact, it should have the biggest opening since Guardians of the Galaxy Vol 2. The competition will put a dent in Despicable Me 3’s box office during the weekend, but even so, it will likely break even sometime over the weekend. This weekend last year had The Secret Life of Pets at the top with just over $100 million, while there were four other films earning $10 million or more. Spider-Man: Homecoming should top The Secret Life of Pets, but the depth this year won’t be as good. If 2017 does lose the year-over-year competition, then its lead over 2016 could evaporate completely.
More...
July 6th, 2017

Despicable Me 3 dominated the international box office almost as much as it dominated the domestic box office earning $98.8 million on 8,525 screens in 52 markets for totals of $121.1 million international and $171.2 worldwide. Its biggest opening came from the U.K., where it earned $14.50 million in 608 theaters, while Mexico wasn’t far behind with $12.34 million. However, arguably its most impressive opening came in Brazil where it earned $7.5 million, which is the best opening for an animated film in that market. The film has already made enough to pay for its $75 million production budget, so it is a monster hit. However, its decline from Minions means Universal is more likely to make a second and third Minions movie rather than a fourth Despicable Me. As someone who prefers the Despicable Me movies, this is disappointing. On the other hand, I recognize I’m not in the target demographic for these films, so I really shouldn’t have a say in these things.
More...
July 6th, 2017

The winners of our Me Me Me contest were determined and the entrants with the closest predictions for Despicable Me 3’s opening weekend were...
More...
July 6th, 2017

The Little Hours led the way on the theater average chart with an average of $30,780 in two theaters. This is Gunpowder and Sky’s first release, which makes its first place finish even more impressive. Last week’s winner, The Big Sick, held on well in second place with an average of $23,267 in 71 theaters. The only other film in the $10,000 club was the overall first place film, Despicable Me 3, which earned an average of $15,993.
More...
July 5th, 2017

The weekend box office chart was as predicted, at least in terms of the order. Most of the new releases / top five had weaker openings / sharper declines. Despicable Me 3 still led the way, but with a more subdued $72.43 million. Baby Driver is hoping to earn that much in total after a $20.55 million / $29.58 million opening. This is almost as much as it cost to make. The House, on the other hand, was DOA with just $8.72 million. On the positive side, Monday and Tuesday were much stronger than usual, so rather than looking at the weekend box office and saying it is weaker than anticipated, we could instead say the weekend box office was stretched out over five days. Overall, the box office grew 20% from last week to $169 million. This is down 11% from the same weekend last year, but again, one could argue this is due to a misalignment in the Independence Day holiday. Year-to-date, 2017 is still ahead of 2016, but the lead shrank to under $30 million at $5.64 billion to $5.61 billion.
More...
July 3rd, 2017
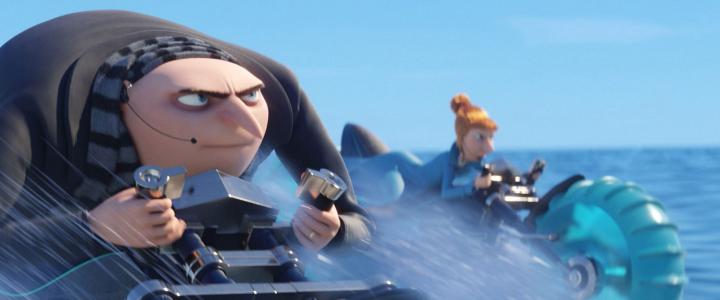
The combination of Canada Day and Independence Day has resulted in some studios not releasing the weekend final numbers today. Some are releasing final numbers, some have updated Sunday’s estimates, while others are just waiting until Wednesday for final results. Despicable Me 3 is in the middle category, as Universal revised its estimate downwards to $72.41 million. This is still a great opening, but it is also a troubling trajectory, as it has fallen a lot from Friday’s Estimates, when it looked like it was going to hit $83 million. Granted, this is still the sixth-biggest opening of the year, so Universal has reason to celebrate, but its internal multiplier suggests short legs for a family film. I think this is a case of franchise fatigue, as its reviews were good, even if they were not as good as the previous Despicable Me films.
More...
July 2nd, 2017

With July 4 falling on a Tuesday this year, this is less a holiday weekend, and more the beginning of a holiday week, and it’s bookended by new releases from two of the industry’s most reliable franchises. Despicable Me 3 starts off festivities this weekend with a solid-but-unspectacular $75.4 million from a record-setting 4,529 theaters. Breaking The Twilight Saga: Eclipse’s record for widest opening weekend of all time is no small feat for Universal, but it’s an ominous sign for the franchise that the only film to open in close to this number of theaters and pull in similar numbers at the box office was Shrek Forever After, which opened with $70.8 million in 4,359 theaters back in 2010. That was the last Shrek movie, and this might be a good time for Gru to call it a day.
More...
July 1st, 2017
As expected, Despicable Me 3 earned first place at the box office on Friday with $29.2 million. This is the best single day for an animated film this year. To emphasize, this isn’t just the best opening day, but the best single day, and it should top that on Saturday. The previous record was $23.00 million, earned by The Lego Batman Movie. This film’s reviews are not as good as The Lego Batman Movie’s reviews are (they both earned A minuses from CinemaScore) so it won’t have the same legs. That said, an $83 million opening is still a great start and roughly on par with Despicable Me 2.
More...
June 30th, 2017
Despicable Me 3 earned $4.1 million during previews last night, which is both good and bad. It is the best previews for an animated film this year, topping the $2.8 million Cars 3 earned earlier this month. However, it is weaker than the $4.7 million Despicable Me 2 earned and that film was a Wednesday release, so that would have depressed its previews even more, which makes this comparison even worse for Despicable Me 3. The Secret Life of Pets opened on a Friday and earned $5.3 million during its previews. If we use that film as a gauge, then Despicable Me 3 will earn $81 million over the weekend. Despicable Me 3 has earned weaker reviews than those The Secret Life of Pets earned, while it is also a sequel, which tends to hurt legs. We predicted $82 million, but that might be a little optimistic now. It should come close, on the other hand.
More...
June 29th, 2017
Despicable Me 3 should dominate the box office this weekend, which is good news, because the last few weeks have been underwhelming. In fact, we haven’t had a monster hit since Wonder Woman started the month off with a bang. The House is an R-rated comedy, but since the last such film to come out bombed, I’m a little worried about its chances. Baby Driver opened on Wednesday and its early numbers are promising. It won’t be a $100 million hit, but it should earn a solid profit for Sony. This weekend last year, there were no monster hits at the box office, but there was solid depth. This weekend, we should be much stronger on top, while the depth won’t be that much weaker, leading to 2017 ending its mini-losing streak.
More...
June 29th, 2017

Transformers: The Last Knight dominated the international box office chart earning $196.2 million in 40 markets, picking up first place in each of those markets. There’s good news and bad news. Good news, this is slightly ahead of Age of Extinction’s combined opening in these markets. Bad news, most of it came from China, where studios only get 25% of the box office, instead of an average 40% in other international markets. The Chinese debut was impressive, $127.24 million on 7,800 screens, including previews. It also did well in South Korea with $9.53 million on 1,727 screens over the weekend for a total opening of $12.87 million. It was nearly as potent in Russia with $8.45 million on 1,456 screens. On the other hand, its openings in the U.K. ($5.90 million in 577 theaters) and in Australia ($3.39 million on 539 screens) were actually worse than its opening here, given the relative size of the markets involved. The film has yet to open in several major markets, including France, where it opens this weekend, so it should remain active on the international chart for a while.
More...
June 28th, 2017
-1-News.jpg)
The winners of our Go Go Power Prizes contest were determined and the entrants with the closest predictions for Transformers: The Last Knight’s opening weekend were...
More...
June 23rd, 2017
Despicable Me 3 is going to win next weekend’s box office race. There’s no doubt about that. In fact, it will make more than Baby Driver and The House will make combined. Because of this, it is the only real choice for the target film in this week’s box office prediction contest. In order to win, one must simply predict the opening three-day weekend box office number for Despicable Me 3.
Whoever comes the closest to predicting the film's opening 3-day weekend box office (Friday to Sunday), without going over, will win a Frankenprise consisting of their choice of either one TV on DVD release, two movies, or a kids package (could be a theatrical release, a couple of single-disc TV on DVD releases, or a full season TV on DVD release).
Whoever comes the closest to predicting the film's opening 3-day weekend box office (Friday to Sunday), without going under, will also win a Frankenprize, as described above.
Finally, we will be choosing an entrant from the group of people who haven't won, or haven't won recently, and they will win the final Frankenprize, as described above.
Entries must be received by 10 a.m., Pacific Time on Friday to be eligible, so don't delay!
More...
June 22nd, 2017
-3-News.jpg)
The Mummy remained on top of the international box office chart, but it fell more than 60% to $53.0 million in 68 markets for totals of $239.1 million internationally and $296.2 million worldwide. The film opened in first place in France, but with just $3.0 million on 615 screens. Its biggest market overall was China, where it was down 77% to $11.63 million over the weekend for a two-week total of $81.62 million. Its best market is arguably South Korea, where it added $3.73 million on 933 screens over the weekend for a two-week total of $23.64 million. The only major market left for the film is Japan, where it opens at the end of the month. It is on pace for about $400 million worldwide, which is not enough to pay for its $195 million production budget. Even if it is a bigger than expected hit on the home market, it will have trouble covering its combined production and advertising budget, which is at least $300 million.
More...
June 1st, 2017
May was a really soft month with only one unqualified hit, Guardians of the Galaxy, Vol. 2, which is climbing towards $375 million domestically. The second biggest hit of the month will be Pirates of the Caribbean: Dead Men Tell No Tales and I would be surprised if it tops $150 million by any serious margin. June looks a lot more profitable. There are five weeks and every week there is at least one film with a great shot at $100 million or more. In fact, there are four films with at least a decent shot at $200 million and we could double the number of $300 million hits released so far this year. Wonder Woman is widely expected to start the month with an explosive debut and pulling in more than $100 million during its opening weekend is more and more likely. That said, Despicable Me 3 will probably end up being the biggest hit overall with over $300 million. Meanwhile, Cars 3 and Transformers: The Last Knight are both aiming for $200 million. Last June was not particularly strong, outside of one hit. Finding Dory earned nearly $500 million domestically, while the second best film, Central Intelligence, barely earned a quarter of that. I don’t think any film will come close to Finding Dory, but there’s a lot more depth this time around and I have high hopes 2017 will extend its lead.
More...
March 14th, 2017
Animated adventure with the voice of Steve Carell opens June 30 ... Full Movie Details.
More...
December 14th, 2016
Animated adventure threequel opens June 30 ... Full Movie Details.
More...