March 29th, 2017
It’s a good week for Pick of the Week contenders, as there are seven such releases on this week’s list. Unfortunately, none of them really scream out as The Pick of the Week. Rogue One: A Star Wars Story is by far the biggest, but it is only out on Video on Demand right now, while Hidden Figures is the best, but again, it is only on VOD this week. There are also a couple of busted Oscar-bait films, Archer: Season Seven is only getting a DVD release, while the previous seasons came out on Blu-ray. In the end, I went with Mystery Science Theater 3000: Volume XXXVIII, partially to celebrate the return of the show.
More...
March 6th, 2017
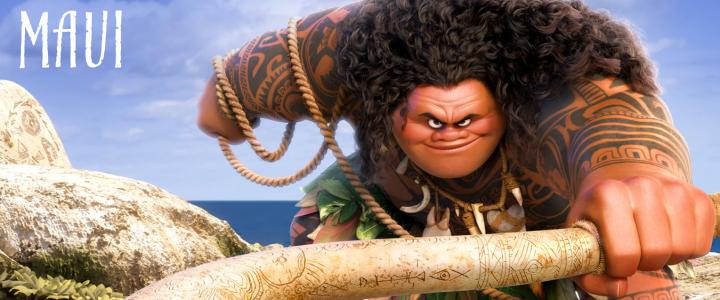
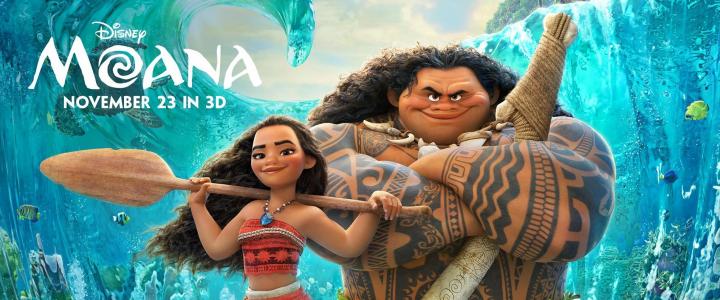
There are not a lot of releases on this week’s list for two major reasons. Firstly, it is a very, very shallow week. Secondly... Dental Surgery. By the time you read this, I might still be at the dentist. There are only two contenders for Pick of the Week, Jackie on Blu-ray and Moana on Blu-ray Combo Pack. It wasn’t particularly close and Moana is easily the Pick of the Week.
More...
February 26th, 2017
-1-News.jpg)
It’s Oscar night and we were live blogging the show. Read on the the highlights of what turned out to be a crazy night.
More...
February 26th, 2017

It’s Oscar night and we will be live blogging the show. Before that, let’s take a last look at the nominations with a few annotations. Nominees in italics are those that have received the most votes from our readers so far in our Oscar contest (which is open to new entries until noon, Pacific, today—enter now!). Bold films are those films I think will win. Meanwhile, those that are Underlined are those I want to win. Not all categories have underlined nominees, because not all categories have someone I’m cheering for, or because there are two nominees I couldn’t pick between.
More...
February 12th, 2017

The BAFTA winners were announced on Sunday and there were very few surprises to talk about. La La Land again won the most awards with five, while only two other films, Lion and Manchester by the Sea, earned more than one award. They each won two.
More...
January 24th, 2017
The Oscar nominations were announced starting at 5:18 am Pacific time. Nothing is good that early in the morning. Worse still, it’s a boring year for nominations with very few surprises worth talking about, especially in the biggest categories. Leading the way was La La Land with 14 nominations, tying the record.
More...
January 11th, 2017
The BAFTA nominations were announced and it should come as no surprise what film lead the way... La La Land with 11 nominations, Nocturnal Animals and Arrival are tied for second with nine nominations a piece.
More...
December 20th, 2016
Rogue One: A Star Wars Story started its international run where everyone expected it to start, in first place. It earned $135.5 million in 54 markets during its opening weekend, which is a mixed result. Hear me out, the film did manage the best opening of 2016 in a dozen markets, including a quartet of major markets: France ($10.0 million); Germany ($12.5 million); Spain ($4.5 million); and the U.K. ($21.59 million). However, it also missed expectations in the same number of major markets: Brazil ($5.3 million); Italy ($3.22 million); Mexico ($5.1 million); and Russia ($5.76 million). Other major market openings for the film include Australia ($10.77 million) and Japan ($7.9 million). So “mixed” in this case means “one of the biggest releases of the year, but not a The Force Awakens-level phenomenon". In a more direct comparison, the film earned just over half of what The Force Awakens opened with in these markets. If the film has the same legs, then it will finish with close to $600 million internationally and over $1 billion worldwide.
More...
December 19th, 2016

As expected, Rogue One: A Star Wars Story dominated the weekend box office chart with $155.08 million. This is well over twice as much as every other release combined. It is nearly twice as much as last weekend’s total box office. This helped the box office grow by 154%, reaching $211 million. Sadly, this was over $100 million or 32% lower than the same weekend last year when The Force Awakens dominated the chart. The year-over-year decline can be best summed up as within expectations. 2016 is still ahead of 2015 by a massive amount at $10.47 billion to $9.96 billion, but that will change as we see more numbers for Rogue One come in. On a more big picture look, Disney became the first studio ever to hit $7 billion worldwide in one year. They now have the record for biggest yearly domestic box office and biggest yearly worldwide box office, while it is just $160 million away from the international record as well.
More...
December 15th, 2016

It is a deceptively busy weekend, as there are two wide releases, Rogue One: A Star Wars Story and Collateral Beauty, and two films that are “expanding wide”, Manchester by the Sea and La La Land. However, while that looks like a lot, in reality Rogue One: A Star Wars Story is the only film most people are talking about. In fact, it is going to dominate the box office to such a degree that its only real competition is The Force Awakens, which opened this weekend last year. Unfortunately for Rogue One, there’s almost no chance it will match The Force Awakens. In fact, there’s almost no chance the entire box office will match the $247.97 million The Force Awakens opened with. 2016 is going to get crushed in the year-over-year comparison. That said, 2016 has a nearly $460 million lead over 2015, so has long as Rogue One tops $100 million over the weekend, it should be enough to keep 2016 ahead in terms of raw box office numbers.
More...
December 14th, 2016

For the fourth and final time, Fantastic Beasts and Where to Find Them earned first place on the international chart, this time earning $33.1 million in 67 markets. It now has totals of $480.7 million internationally and $679.6 million worldwide. This will be the last weekend the film will spend in first place, but it should last long enough to overtake Suicide Squad on the 2016 Worldwide chart.
More...
December 13th, 2016

As predicted, Moana was able to grab first place on the weekend box office chart. On the downside, it slipped a little faster than expected. Additionally, Office Christmas Party missed expectations and this led to the overall box office falling 13% from last weekend to $83 million. That said, this is still 7.0% higher than the same weekend last year and that’s more important. Year-to-date, 2016 maintained its $460 million / 4.7% lead over 2015 at $10.23 billion to $9.77 billion. This lead will take a serious hit this coming weekend when Rogue One goes against The Force Awakens. That said, unless Rogue One opens with less than $100 million during its weekend, 2016 should still come out ahead at the end of the year.
More...
December 10th, 2016
As expected, Office Christmas Party earned first place on Friday with $6.6 million. Its reviews have settled at 44% positive, which is lower than you would like, but fine for this type of release. Likewise, it earned a B from CinemaScore. Neither figure will help its legs, but neither will really hurt them either. By comparison, The Night Before earned $3.56 million during its opening day on its way to a $9.88 million opening weekend. If Office Christmas Party has the same internal multiplier, then it will earn $18.3 million this weekend. However, The Night Before earned 66% positive reviews and an A- from CinemaScore. Office Christmas Party’s weaker performances with critics and audiences will likely result in a lower legs and an opening weekend of just over $17 million.
More...
December 8th, 2016

There is only one wide release this week, Office Christmas Party. There are also two films expanding semi-wide, Miss Sloane and Nocturnal Animals. I doubt both of them will make the top ten, but I would be equally surprised if neither did. At the beginning of the month, I assumed Office Christmas Party would win this weekend, but it is looking like Moana has a shot at the threepeat. It could be a really close race with the two films changing positions on the daily chart. Meanwhile, this weekend last year, In the Heart of the Sea bombed earning just $11.05 million on a $100 million budget. The Hunger Games: Mockingjay, Part 2 earned first place with $11.41 million. Both Office Christmas Party and Moana will top that with ease. Fantastic Beasts and Where to Find Them might also beat that. On the other hand, last year there were four films that earned more than $10 million, while this year there will be no more than 3. I still think 2016 will win, but it could be close.
More...
December 8th, 2016

Fantastic Beasts and Where to Find Them remained locked in first place with $60.4 million in 67 markets for totals of $424.4 million internationally and $607.5 million worldwide. It reached both $400 million internationally and $600 million worldwide, which is twice the reason to celebration. On the down side, the film has run out of major markets to open in, so it will quickly drop down the chart from now on. On the positive side, the film is already in the top ten on the 2016 Worldwide chart and will climb a little bit more before it is done.
More...
December 6th, 2016
As expected, Moana dominated the weekend box office chart with a $10 million lead over its nearest competitor earning $28.27 million. Fantastic Beasts and Where to Find Them also did well with $18.12 million. Unfortunately, those were the only two films to earn more than $10 million over the weekend and this left the overall box office down a massive 48% from last weekend to just $95 million. Worse still, this is 2.8% lower than the same weekend last year. I’m actually surprised it’s that close, because there were four films that earned more than $10 million last year, including the biggest new release, Krampus. 2016 was able to crack $10 billion before the weekend and has a very substantial lead at $10.12 billion to $9.66 billion for 2015.
More...
December 4th, 2016

The top of the box office chart remains a tale of two movies this weekend, with Moana maintaining an impressive lead over Fantastic Beasts and Where to Find Them, but both movies doing very nicely heading into the Christmas season. Moana tops the chart again this weekend with $28.4 million, for a total of $119.9 million at the end of the weekend. By way of comparison, Frozen had earned $134.3 million at this point in its run, but fell a slightly larger 53% from Thanksgiving, compared to Moana’s 50% decline. The next few weeks should be very lucrative for the animated adventure, which is likely to sail past $300 million at the domestic box office.
More...
December 3rd, 2016
As expected, Moana led the way at the box office on Friday. It did so thanks to a $6.45 million haul. This is just 4.2% lower than Frozen managed during the same period in its run. If Moana has the same internal multiplier over the weekend, then it will earn just over $30 million. That would be amazing. That would be $6 million better than expected. I think it is going to have trouble keeping up that pace, but a sub-50% drop-off to $29 million is still impressive, especially for this time of year. The film has $97.96 million as of Friday and by the time you read this, it may have already crossed $100 million on Saturday. If it continues to show legs like this, then the film will still be in wide release on Christmas Day, which will be a boon to its box office numbers.
More...
December 1st, 2016

December usually starts on a really soft note, because the weekend after Thanksgiving is usually a terrible weekend. This time around, the wide release of the week is Incarnate, which is opening in 1,737 theaters and is expected to struggle to reach the top ten. That leaves Moana with an easy route to first place. This weekend last year, Krampus opened in second place with $16.29 million. Incarnate will only earn a fraction of that. On the other hand, the number one film was The Hunger Games: Mockingjay, Part 2, which earned $18.86 million during the weekend and Moana should easily beat that. I don’t think 2016 will come out ahead, but it also shouldn’t be a disaster either.
More...
November 30th, 2016

Fantastic Beasts and Where to Find Them remained in first place with $132.0 million in 67 markets for totals of $317.5 million internationally and $473.5 million worldwide. Its biggest debut came from China where it opened with $41.70 million, which is a little behind Doctor Strange’s opening earlier this month. On the other hand, the film is already $10 million ahead of what will be Doctor Strange’s lifetime total in the U.K. with $11.07 million in 666 theaters over the weekend for a two-week total of $37.52 million.
More...
November 29th, 2016
-1-News.jpg)
Lion led the way on the theater average chart this week with an average of $30,840 in four theaters. Its reviews are great and it could become a sleeper hit throughout the Christmas holidays. Up next was Manchester by the Sea with an average of $25,541 in 48 theaters. It still has plenty of room to expand and its Awards Season buzz is growing. Miss Sloane opened with an average of $19,932 in three theaters. This is good, but not good enough to think it will expand truly wide. The overall number one film, Moana, was next with an average of $14,615. The final film in the $10,000 club was Fantastic Beasts and Where to Find Them with an average of $10,880.
More...
November 29th, 2016
As expected, Moana earned first place over the Thanksgiving weekend and became the biggest true opener in the holiday’s history. (Technically Frozen opened in limited release the week before and as we learned from Futurama, technically correct is the best kind of correct.) The film was a little more front-loaded than expected and nearly matched our predictions. Fantastic Beasts and Where to Find Them held on better than predicted and that one-two punch helped the overall box office grow 17% from last weekend to $184 million, over the three-day portion of the weekend. This is nearly identical to the same weekend last year; in fact, it was up by less than 1%. Year-to-date, 2016 has pulled in $9.99 billion. 2016 will soon become the eighth year in a row to reach the $10 billion milestone. This is 5.0% / $470 million above last year’s pace. I’ve been saying for a while that we needed to enter December with a $300 million advantage over 2015 in order to come out ahead at the end of the year, so this is great news.
More...
November 27th, 2016

Disney’s domination of Thanksgiving weekend will continue in 2016, with Moana expected to post $55.5 million for the three-day weekend and $81.1 million in total, making it either the second-best or best Thanksgiving opener of all time, depending on what you consider an “opener.” Disney is claiming second place for Moana behind Frozen, which had a $67.4 million 3-day weekend, and $93.6 million 5-day weekend back in 2013. That film had already opened in a single theater the weekend before, so if we want to split hairs, it technically wasn’t opening that weekend. Either way you look at it, it’s a great start for Moana, and another handsome win for Disney. The studio can now claim the top six 5-day Thanksgiving debuts and and the top eight 3-day Thanksgiving openings of all time.
More...
November 26th, 2016

Moana remained the dominant film at the box office on Friday, pulling in $21.86 million. This is lower than the $23 million we were hoping for yesterday, but it still puts the film on pace to break the record for the biggest Thanksgiving opening, currently held by Tangled at $48.77 million / $68.71 million. (Frozen opened in limited release the week before Thanksgiving, so it technically doesn’t hold the record for best Thanksgiving opening, although it does have the best Thanksgiving weekend for an animated film with $67.4 million / $93.6 million.) Moana should earn just under $55 million over the three-day weekend for a five-day total of just over $80 million. This would put the film in a tie with Toy Story 2 for sixth place on the list of all-time best Thanksgiving weekends, depending on how well it does for the rest of the weekend. Furthermore, its 98% positive reviews and its A rating from CinemaScore suggest long legs going forward. It should still be in a lot of theaters on Christmas day.
More...
November 24th, 2016
Fantastic Beasts and Where to Find Them opened in first place on the international chart with $143.3 million in 63 markets. The film had the biggest opening of the Harry Potter franchise in 16 of those 63 markets, but ironically not in the U.K., where it had its biggest opening. The film debuted in first place there with $18.90 million in 666 theaters. This is the third best in the franchise behind the two Deathly Hallows films. Some of the markets where Fantastic Beasts set the franchise record include South Korea, where it made $10.64 million on 1,431 screens over the weekend for a total opening of $14.15 million. It did the same in Russia with $10.29 million on 1,173 screens and in Brazil with $6.4 million.
More...
November 24th, 2016

Moana started its box office run in first place, which is no shock. However, it did so with an opening day of $15.68 million. This is the new record for the biggest Wednesday before Thanksgiving, topping the previous record-holder, Frozen, which managed $15.16 million back in 2013. Frozen is also the biggest animated hit worldwide, so I don’t think using it is a good idea. Instead, let’s use The Good Dinosaur, which opened this time last year with $9.76 million. If the two films have the same legs, then Moana will earn $62.90 million / $89.09 million over the three-day / five day weekend. That’s a little higher than predicted and it might be too cautious. Moana’s reviews are 97% positive, while its CinemaScore is a solid A. The Good Dinosaur’s reviews were only 77% positive, although it too earned an A from CinemaScore. Hopefully the reviews will translate into better legs and an even bigger opening weekend.
More...
November 24th, 2016
The winners of our Fantastic Prizes contest contest were determined and the entrants with the closest predictions for Fantastic Beasts and Where to Find Them opening weekend were...
More...
November 23rd, 2016
Thanksgiving weekend is one of the most lucrative weekends of the year and this time around we could have a relatively close battle between a new release, Moana, and last week’s number one film, Fantastic Beasts and Where to Find Them. At least that’s what analysts thought, before we saw the preview numbers. None of the rest of the new wide releases are expected to do much. Allied could become a midlevel hit, but I would be surprised if its budget was only midlevel. Bad Santa 2 is on its way to becoming another comedy sequel that bombs. If Rules Don’t Apply’s previews are any indication, it will become one of the worst box office performers of the year. This weekend last year, The Hunger Games: Mockingjay, Part 2 beat The Good Dinosaur rather easily. However, Fantastic Beasts started slower than Moana, so I think we will have a new winner this week.
More...
November 23rd, 2016

Manchester by the Sea led the way on the theater average chart with an average of $64,125 in four theaters. That isn’t the best average we’ve seen this year, but it is fourth place for a 2016 release. Fantastic Beasts and Where to Find Them earned first place on the overall chart and second place with $17,954 on this chart. Nocturnal Animals earned an average of $13,315 in 37 theaters. That’s an impressive average considering how wide it was playing. Best Worst Thing That Ever Could Have Happened earned an average of $11,745 in two theaters. Meanwhile, the re-release of Daughters of the Dust was the final film in the $10,000 club earning $10,842 in its lone theater.
More...
November 22nd, 2016
As expected, Fantastic Beasts and Where to Find Them dominated the box office earning nearly as much as the rest of the films combined. However, it was unexpectedly weak earning just $74.40 million. In fact, every film we talked about on Thursday’s predictions underperformed and the overall box office was down to $158 million. Granted, “down” in this case is only off by 0.1%, but considering we were expecting significant growth, even a little drop is distressing. Worse still, the box office is off by 8.9% from this weekend last year. Again, we were expecting growth in the year-over-year comparison, so a drop this big really hurts. Year-to-date, 2016 has pulled in $9.49 billion, which is 5.9% or $540 million better than last year’s pace. That said, I wouldn’t panic, as Moana should help the box office bounce back this weekend.
More...
November 20th, 2016
Fantastic Beasts and Where to Find Them is doing everything Warner Bros. could have wished for this weekend, posting a lively $75 million opening in the US, hitting $143.3 million internationally for a global opening over $200 million, and getting a A CinemaScore that should give it positive word of mouth going into Thanksgiving. For a franchise reboot, that’s a lot of reasons to be happy, although its opening is well below the openings enjoyed by the original Harry Potter franchise. The worst of those, Chamber of Secrets, opened with $88 million over three days (Order of the Phoenix and Half-Blood Prince both technically had slower weekends than Chamber of Secrets, but both of them opened on Wednesday, and they still did over $75 million Friday–Sunday).
More...
November 19th, 2016

As expected, Fantastic Beasts and Where to Find Them easily earned first place on Friday. However, it only managed $29.7 million, which was well below expectations. This is the worst opening day in the Harry Potter franchise since The Chamber of Secrets. (The two films are so close that the final figure for Fantastic Beasts could be the worst in the franchise.) The reviews are weaker than the franchise as a whole, but its CinemaScore is an A and that’s roughly average for the previous 8 Harry Potter films. The film should still earn between $70 million and $75 million over the weekend, depending on if the high CinemaScore can overcome the Fanboy Effect. I would choose to be optimistic, but that hasn’t worked out this weekend.
More...
November 18th, 2016

Fantastic Beasts and Where to Find Them pulled in $8.75 million during its midnight shows last night. That’s good, but a little lower than expected and not even the best of the fall so far. It was beaten by Doctor Strange, which earned $9.4 million just two weeks ago. Worse still, Fantastic Beasts' reviews have fallen to 74% positive. That’s still good for a blockbuster release, but it is the lowest in the Harry Potter franchise and will likely hurt the film’s box office performance over the weekend. It should still make over $80 million this weekend, but it will be close. We might have to revise that prediction lower tomorrow when we have Friday’s estimates.
More...
November 17th, 2016
At the beginning of the month, we thought there would be four wide releases / expansions this week. However, it turns out there will be just one, Fantastic Beasts and Where to Find Them. The lack of wide releases should help it at the box office and there is a small chance it could top $100 million over the next three days. While there are no other wide releases, there are a few films opening or expanding semi-wide. Of these, The Edge of Seventeen is the only one with a realistic shot at the top five. It is earning the best reviews of the week and did earn a lot of film festival buzz, so that should help. Billy Lynn’s Long Halftime Walk had an amazing opening in limited release last weekend, but it will likely struggle as it expands into just over 1,000 theaters this weekend. Finally there’s Bleed for This, which is expected to barely make the top ten. This weekend last year, the final installment of the Hunger Games franchise opened with just over $100 million. There’s a slim chance Fantastic Beasts will do the same. Even if it doesn’t, the depth this year is much better than last year and that should help 2016 win in the year-over-year comparison.
More...
November 16th, 2016
-1-News.jpg)
The winners of our Arrive on Time contest were determined and the entrants with the closest predictions for Arrival opening weekend were...
More...
November 10th, 2016
There are four films opening or expanding wide next week, at least that’s what we thought would happen at the beginning of the month. Now we learn The Edge of Seventeen is opening semi-wide, Billy Lynn’s Long Halftime Walk is only expanding semi-wide, while we still don’t know what is happening with Bleed for This. This is great news for Fantastic Beasts and Where to Find Them, as it will have even less competition that anticipated. It is also the only reasonable choice for the target film in this week’s Box Office Prediction contest. In order to win, one must simply predict the opening weekend box office number for Fantastic Beasts and Where to Find Them.
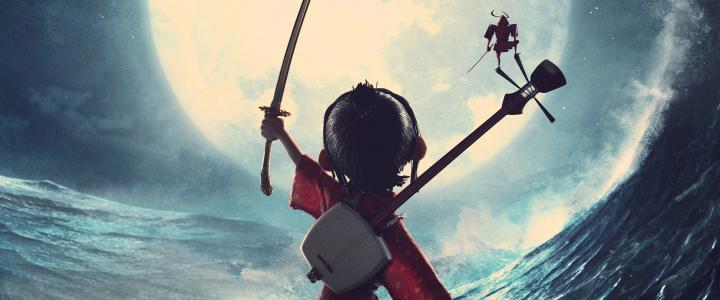
Whoever comes the closest to predicting the film's opening 3-day weekend box office (Friday to Sunday), without going over, will win a copy of Kubo and the Two Strings on Blu-ray Combo Pack.
Whoever comes the closest to predicting the film's opening 3-day weekend box office (Friday to Sunday), without going under, will also win a previously reviewed movie.
Finally, we will be choosing an entrant from the group of people who haven't won, or haven't won recently, and they will also win a previously reviewed movie.
Entries must be received by 10 a.m., Pacific Time on Friday to be eligible, so don't delay!
More...
November 1st, 2016
-2-News.jpg)
October turned out to be a mixed month. On the one hand, not one movie earned $100 million, or even came close. However, it was also a more steady month than last October and the last two weeks really helped 2016 in the year-over-year comparisons. In November, we have five films with at least a shot at $100 million, three of which should have no trouble getting to at least $200 million. A little while ago, I thought Fantastic Beasts and Where to Find Them would be the biggest hit of the month, but the buzz took a hit recently. More on that below. Meanwhile, Doctor Strange’s reviews are currently 90% positive and that should help it out at the box office. The third very likely $200 million hit is Moana. There is certainly precedent for an animated movie to be a monster hit at this time of year, but there is also a lot of competition. Last November was similar in strength, with five films that earned more than $100 million and two films that earned more than $200 million. None earned more than $300 million, so that’s the goal for this November. If we can get one $300 million and / or three $200 million movies over the month, then it will be seen as a victory.
More...
April 12th, 2016
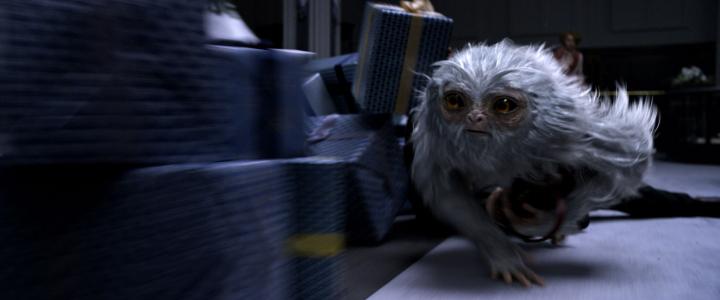
Magical adventure starring Eddie Redmayne, directed by David Yates, opens November 18 ... Full Movie Details.
More...