November 30th, 2010
It was a rather slow week for new releases, as none topped 1 million units, but they still managed top two spots on this week's sales chart. Disney's A Christmas Carol opened in first place with 989,000 units / $16.81 million in consumer spending at retail, while The Last Airbender was second in terms of units sold with 751,000, but fourth in terms of dollars with $12.76 million.
More...
November 16th, 2010
It's getting really close to Black Friday, which is sometimes reported as the busiest shopping day of the year. (It's not. That would be Christmas Eve.) So it should come as no surprise that there's a prime release this week, or should I say re-release. Avatar: Extended Collector's Edition on Blu-ray is the biggest, and arguably the best, release of the week and it is the Pick of the Week. However, there was some competition from The Kids Are All Right on DVD or Blu-ray.
More...
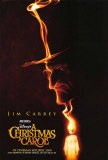
November 13th, 2010
Disney's A Christmas Carol opened in theaters at around this time last year, but it is only making its debut on the home market this week. While the normal window from theatrical debut to home market release usually ranges from about 10 weeks to a few months, the long delay makes perfect sense here, because this is a Christmas story. In fact, it is arguably one of the most famous Christmas stories of all time.
More...
January 17th, 2010
More than half the films on this week's International Details column were international films, starting with sixth place Io, loro E Lara. That film placed first in Italy with $7.56 million on 608 screens over the weekend, giving it $12.91 million in total.
More...
January 10th, 2010
Black Lightning opened in sixth place internationally with $8.42 million on 798 screens in 5 markets.
Those markets include Russia, Ukraine, Estonia, Latvia and Lithuania.
The latest from Timur Bekmambetov debuted in second place in his native Russia behind Avatar with an estimated $8 million on 700 screens.
More...
December 22nd, 2009
It was a fantastic weekend at the box office as the top film topped expectations and broke records, admittedly by narrow margins, but records nonetheless.
Overall the box office pulled in $138 million, which was 42% higher than last weekend and an outstanding 56% higher than the same weekend last year.
Year-to-date, 2009 has earned $9.96 billion, extending its record and moving closer to the $10 billion milestone.
This time last year the cumulative box office was $9.15 billion, meaning 2009 has an 8.8% lead.
More...
December 17th, 2009
There are two wide releases this weekend, but mostly everyone is just talking about Avatar, its box office potential, and its obvious comparisons to Titanic.
It should have no trouble beating the combined $43 million made by all three wide releases this weekend last year, and will almost certainly make more during its opening weekend than the $53 million that Titanic made during its opening week.
And that's the low end of expectations.
On the high end, it has a number of records in its sights.
More...
December 16th, 2009
A couple of Asian films reached the top five and they were part of a large group of international films to chart this week.
In fact, five of the top ten and fourteen of the top thirty were truly international films.
However, the top three were all Hollywood blockbusters; in fact, they were the same three blockbusters that led the way last week.
The Twilight Saga - New Moon remained in first place with $22.29 million on 7,856 screens in 63 markets for a total of $357.48 million internationally and $624.80 million worldwide.
The film managed to remain it first place in South Korea with $2.59 million on 545 screens over the weekend for a total of $9.76 million after two.
Meanwhile, it is still strong in Germany and added $2.98 million on 736 screens over the weekend for a total of $29.52 million after three and it hit $40 million in the U.K. with $1.22 million on 458 screens over the weekend for a total of $40.57 million after four.
The film is rapidly running out of places to open, but it could end its run with $400 million internationally and nearly $700 million worldwide.
More...
December 14th, 2009
The box office was a little mixed this weekend with good news balancing the bad news. For instance, the two new releases in the top five both disappointed, but all three holdovers topped expectations.
Overall business was down 2.3% from last weekend, but up 6.0% from the same weekend last year, which is always the more important number.
Year-to-date, 2009 has now pulled in $9.79 billion, which is 8.6% higher than the same pace last year and more than $100 million more than the previous record.
More...
December 13th, 2009
Disney claimed top spot at the box office this weekend as The Princess and the Frog expanded nationwide.
But with a weekend box office estimated at $25 million, the movie will need to have great legs over the holidays if Disney's going to recoup its investment.
The movie has good reviews and is ideal family fare, so its chances are good, but the studio is looking at the same nail biting exercise as they're going through with A Christmas Carol, which opened with $30 million and reached an estimated $124 million this weekend.
More...
December 9th, 2009
A trio of films hit major milestones at the international box office this weekend, starting with The Twilight Saga - New Moon.
That film remained in first place with $41.83 million on 8,144 screens in 61 markets for a total of $320.04 million internationally and $575.40 million worldwide.
This week, it opened in South Korea with $4.07 million on 622 screens over the weekend and $5.68 million in total.
This is not a lot for the market compared to other Hollywood blockbusters, but it is almost as much as the original made during its entire run and it will surpass the earlier film by next week.
Meanwhile in Germany, the film did just that with $5.76 million on 703 screens over the weekend and $25.39 million after two, which is significantly more than the $22.65 million the original made there.
At this pace, New Moon will have little trouble earning more internationally than Twilight made worldwide, while it will crack $600 million worldwide by the weekend.
More...
December 7th, 2009
It was one of those good news / bad news weekends; however, the bad news was minor compared to the overwhelming positive stories to talk about. Yes, the overall box office plummeted 47% from last weekend to $99 million, but that was expected for a post-holiday weekend and it was still 20% higher than the same weekend last year. Also, total ticket sales for the year now sit at $9.66 billion, which is not only 8.5% higher than last year's pace, it is within a rounding error of 2007's record-setting total.
That means it is possible that 2009 has already set the record for biggest yearly box office with three weeks left in the year.
More...
December 2nd, 2009
The Twilight Saga - New Moon remained in the top spot on the international chart with $82.38 million on 8,292 screens in 52 markets for a total of $251.33 million internationally and $482.28 million worldwide.
This includes a number of new markets for the film, but most were of the smaller variety.
It did place first in Germany with $16.95 million on 703 screens, but that includes previews.
On the other hand, it bombed in Japan, opening in fifth place with just $792,000 on 197 screens and was even worse in South Korea, debuting in eighth place with $129,000 on 47 screens over the weekend and $166,000 in total.
As far as holdovers go, the film was surprisingly consistent at roughly 60% down in most major markets.
This includes the U.K. where it was down 63% to $7.11 million on 504 screens; however, it still managed first place in that market, while it now has $33.57 million after just two weeks of release compared to the lifetime total of $16.31 million for its predecessor.
It is important to note that Twilight was surprisingly weak in the U.K. compared to its box office performance in most major markets.
That said, New Moon has topped the lifetime total of the earlier film in every single major market it opened in last weekend, which is an amazing feat.
It has yet to open in only a few other markets, but unless the film cost a lot more to make than has been reported, it has already shown a sizeable profit.
More...
November 30th, 2009
Thanksgiving was a record-breaking weekend in more than one way.
First, total ticket sales amounted to $188 million over three days and $273 million over five, which is a record for the long weekend.
Over the three-day portion of the weekend, the box office was actually down 28% from last weekend, but compared to last year it was up just under 16%, while the five-day total was nearly 17% higher.
Year-to-date, 2009 has earned a total of $9.52 billion, which is 8.4% higher than the same point last year.
In fact, 2009 is now the third-highest-grossing year of all-time and just $150 million away from earning the crown.
Breaking the record for total box office is just a matter of when, not if, while 2009 could be the first year total ticket sales crack $10 billion.
More...
November 26th, 2009
It's Thanksgiving long weekend, one of the best holidays in terms of box office drawing power. However, none of the new releases seem like they have what it takes to really draw in moviegoers. On the other hand, New Moon broke a number of records last weekend, and it has a slim chance at breaking a few more this weekend. Even if it doesn't, it should top the top film from last year, Four Christmases, which should lead to another gain year-over-year.
More...
November 25th, 2009
There were two movies that cracked the $100 million level on this week's international chart, including the new number one film, The Twilight Saga - New Moon, which opened with $124.22 million on 6,578 screens in 24 markets over the weekend for a total opening of $136.01 million.
Its best opening came in the U.K. where it pulled in $19.38 million on 497 screens, while it also cracked $10 million in a number of major markets, some of which reached the mark if you include midweek numbers.
In France, it made $17 million on 751 screens, which was the ninth best American release in that market.
In Spain, the film made $15.16 million on 634 screens, which includes the third best Wednesday opening in that market.
Australia and Italy had nearly identical openings with the former pulling in $14.85 million on 530 screens and the latter earning $14.34 million.
Brazil was also impressive with $11.22 million on 411 screens.
More...
November 23rd, 2009
New Moon broke all manner of records over the weekend, which was great news for Summit, and for the industry as a whole.
New Moon made more all by itself than all other movies combined pulled in last weekend and the overall box office was $259 million, the second biggest weekend on record.
Compared to last week, we saw a 85% increase, while compared to the same weekend last year, 2009 grew by 57%.
Year-to-date, 2009 has now pulled in $9.20 billion, which is just shy of 8.0% higher than last year's pace.
Additionally, it is just ahead of 2002's final tally, making 2009 the sixth biggest year so far, and we have more than a full month ahead, including two major holidays.
Simply amazing.
More...
November 19th, 2009
This could be a surprising weekend at the box office, as the buzz for New Moon has hit new heights of insanity.
There's no doubt that it will be the number one film of the weekend, and almost no doubt that it will top Twilight, which was the number one film this week last year.
It appears the only real question is how many records can it break along the way.
More...
November 18th, 2009
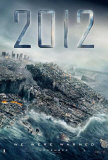
2012 crushed the competition with $166.19 million on 12,943 screens in 76 markets and $231.43 million worldwide over its debut weekend.
This is the fifth best international opening of all time, and is massively better than expected.
The film's biggest market was Russia where it pulled in $16.31 million on 840 screens, while it topped $10 million in Germany ($12.53 million on 756 screens) and the U.K. ($10.83 million on 480 screens).
Other major markets included Spain ($8.56 million on 606 screens), South Korea ($8.26 million on 855 screens over the weekend and $10.04 million in total), Italy ($7.64 million on 532), Australia ($5.67 million on 405), Brazil ($5.29 million on 550) and Mexico ($5.03 million on 780).
More...
November 16th, 2009
Great news at the box office, as the number one film topped expectations by a significant margin.
In fact, the top three films all did much better than expected.
On the down side, the rest of the films we talked about on Thursday struggled and this hurt the overall box office.
The total take was up 16.9% from last weekend at $140 million, but this was 5.8% lower than the same weekend last year.
Year to date, 2009 has pulled in $8.91 billion, which is 7.0% higher than last year's pace, and by this time next week 2009 will be only the seventh year to cross $9 billion in total ticket sales.
More...
November 12th, 2009
Just the one truly wide release this week, but we also have a semi-wide release that could sneak its way into the top ten, as well as a limited release that is expanding.
That wide release, 2012, is a disaster flick, which might be the best word to describe the overall box office, at least compared to last year.
Very few people think 2012 will top the $67.5 million opening of Quantum of Solace, which debuted this weekend last year.
In fact, if it misses that mark by a mere $10 million, I think a lot of people will be pleasantly surprised, while if it is short by $20 million or more, not too many people will be shocked.
Additionally, the holdovers are going to get crushed in this comparison as well, so there is almost no chance that 2009 will come out ahead.
It's a matter of minimizing the damage.
More...
November 11th, 2009
This Is It saw its weekend haul fall 42% internationally, but it still stood on top with $29.50 million on 8,623 screens in 76 markets for a total of $129.23 million internationally and $186.24 million worldwide.
The film reached $100 million internationally early in the weekend and could reach $200 million worldwide, perhaps before this weekend.
The film held on well in Japan to remain in first place with $3.93 million on 322 screens for a total of $23.52 million.
It also remained in first place in Australia with $1.74 million on 292 screens over the weekend for a total of $6.80 million.
On the other hand, it was down 72% in the U.K. and fell to second place with $2.27 million on 486 screens over the weekend for a total of $13.61 million, also after two.
More...
November 11th, 2009
Disney's A Christmas Carol took in $4.2 million on 181 IMAX screens during its opening, which represented 14% of its total box office in just 3% of the theaters it played in.
Some are reporting this is the highest percentage earned by a wide release, which is partially due to its per screen average of $23,000, but it also had a lot to do with its softer than expected theatrical debut.
It opened with $560,000 internationally in 28 IMAX theaters, and it is only half way done with its international rollout.
More...
November 10th, 2009
The winners of our Holiday Crossover contest were determined and they are...
More...
November 10th, 2009
It was a mixed weekend at the box office as the overall ticket sales reached $120 million. This was 32% higher than last weekend; however, Halloween had a lot to do with that. More importantly, it was 16% lower than the same weekend last year. Even so, 2009 remains solidly ahead of 2008 by a 7.3% margin. In fact, its total of $8.72 billion is not only well ahead of last year's pace of $8.13 billion, it is almost as much as 2005 in total, and is already the eighth best yearly total ever.
More...
November 8th, 2009
Disney's A Christmas Carol got off to a disappointing start over the weekend, according to studio estimates.
While a $31 million debut is nothing to sniff at, it's well below expectations and might leave the movie outside the top 50 November weekends (see list).
This might be a case of opening a Christmas movie too soon, and Disney will be looking for long legs through Thanksgiving and into the Holiday Season proper, so all is not lost yet, but the next couple of weeks will be key.
More...
November 5th, 2009
The holiday season unofficial starts this weekend with the first Christmas release of the year.
Disney's A Christmas Carol is clearly the favorite to top the chart, but it is the only big release coming out this week, and it is unlikely to match last year's winner, Madagascar 2.
This means 2009 will have a tough time keeping up with last year's pace.
More...
November 1st, 2009
October was not a month to remember, as only two films really beat expectations. (Although Paranormal Activity was the most unexpected hit during the October, it actually opened in September, so one could argue it's not really an 'October hit'.) This month we have a massive collection of potential blockbusters, some potential Oscar contenders, as well as a few unfortunate films that might be squeezed out by the competition. Compared to last November, we might have the same number of $100 million hits, assuming all movies match expectations (fat chance); we have a limited release from this month become the Awards Season darling and reach that milestone (monstrously unlikely); and we count The Princess and the Frog as a November releases (intellectually dishonest). That said, if three or four legitimate November releases reach that milestone, then 2009 will be on pace to tie or break the record for most $100 million released in one calendar year. But overall, 2009 will likely see its lead over 2008 shrink during the next 30 days.
More...
October 30th, 2009
It is not yet Halloween, but the first Christmas release comes out next week, Disney's A Christmas Carol, and we have some Christmas prizes to match it. We also have a couple of spooky prizes to go with Halloween. In order to win, one must simply predict the opening weekend box office of Disney's A Christmas Carol.
Whoever comes the closest to predicting the film's opening 3-day weekend box office (Friday to Sunday), without going over, will win a copy of Winnie the Pooh - Seasons of Giving on DVD and Medium - Season Five on DVD.
Meanwhile, whoever comes the closest to predicting the film's opening 3-day weekend box office (Friday to Sunday), without going under, will also win a copy of Winnie the Pooh - Seasons of Giving on DVD, as well as One Step Beyond - Season One on DVD.
Entries must be received by 10 a.m., Pacific Time on Friday to be eligible, so don't delay!
More...
July 7th, 2009
Transformers - Revenge of the Fallen made it all the way to $30 million on IMAX screens worldwide in just 12 days, which is the fastest a film has ever reached that milestone on IMAX.
It added $6 million during the past weekend with a $4.6 million / $1.4 million domestic / international split.
More...
May 20th, 2009
The second weekend for Star Trek saw even more records fall as it added $5.3 million on 138 screens over the weekend for a per screen average of $38,000, both of which are records. Overall the film has made $19.9 million worldwide playing on 163 screens, which is also a record for this point in a film's IMAX run. That's the good news. The bad news is on Friday, the film will be booted out of IMAX theaters to make room for Night at the Museum 2.
More...
January 3rd, 2008
This week's round of new casting information contains updates for Bolt, Snow Angels, The Trial of the Chicago 7, and more!
More...
December 13th, 2007
This week's round of new casting information contains updates for Julie & Julia, A Plumm Summer, Yes Man, and more!
More...
December 6th, 2007
This week's round of new casting information contains updates for A Christmas Carol, Milk, Seven Pounds, and more!
More...
November 29th, 2007
This week's round of new casting information contains updates for He Was a Quiet Man, His Dark Materials: The Golden Compass, Shutter Island, and more!
More...
October 11th, 2007
This week's round of new casting information contains updates for Avatar, Harry Potter and the Half-Blood Prince, Star Trek XI, and more!
More...
October 9th, 2007
This week another number of upcoming movies, new stars and directors have been added to our archive!
More...
October 7th, 2007
This week's round of new movie release information contains release dates for Case 39, Inkheart, Four Christmases and more!
More...