February 24th, 2019
-2-News.jpg)
It’s Oscar night and we will be live blogging the show. We will announce the winners and have our reactions as they happen, while keeping track of how our readers did in predicting the outcomes.
More...
February 24th, 2019
-1-News.jpg)
It’s Oscar Day, and we will be live blogging the show. Before that, let’s take a last look at the nominations with a few annotations. in Italics are those that have received the most votes from our readers so far in our Oscar contest (which is open to new entries until noon, Pacific, today—enter now!). Bold films are those films I think will win. Meanwhile, those that are Underlined are those I want to win. Not all categories have underlined nominees, because not all categories have someone I’m cheering for, or because there are two nominees I couldn’t pick between. For example, I would be happy with half of the Best Picture nominees winning.
More...
February 7th, 2019

With our annual Oscar Prediction contest underway, now is the best time to look at the nominees and try and figure out who the favorites are and which films should just feel honored to be nominated. A lot of people call this Oscar the Pixar Award, and there is a Pixar film on this list. However, in a shocking twist, it isn’t the overwhelming favorite to win.
More...
January 23rd, 2019
The Oscar nominations were announced yesterday starting at just after 5 am Pacific time. They do this every year for reasons no one has been able to adequately explain to me. Because it was the day after a long weekend, it took a bit of time to get all the normal work done and digest the results. And there were some interesting results to digest. No one film led the way with total nominations, as two films, The Favourite and Roma tied with 10 nominations each.
More...
January 12th, 2019
The BAFTA nominations were announced and The Favorite led the way with 12 nominations. Sometimes the BAFTAs are a really good indicator for who will do well on Oscar night. Other times their bias to British films is too much. I think this year will be an example of the latter and I don't think The Favourite is suddenly an Oscar favorite. That said, there’s still some things you can learn here.
More...
January 4th, 2019

The Producers Guild of America announced their nominations in the theatrical categories today and there are some trends building. However, there are also some questions generated after these nominations were announced.
More...
December 6th, 2018
-1-News.jpg)
The Golden Globes nominations are the second major Awards Season set to come out. It is still very early in the year and the predictive value of the Golden Globes is a little suspect, but there are still some things to learn here. For example Vice led the way with six nominations, so its Oscar chances have gone up, but don’t expect it to lead the way when the Oscars nominations are announced.
More...
August 1st, 2018

This is one of the worst weeks on the home market I can remember. There’s nothing here that even remotely looks like a top-notch release, at least on physical medium. This is the week that Avengers: Infinity War hits Video on Demand and it is dominating the home market in that regard and has to be the Pick of the Week. The only other releases that were close are Star Blazers: Space Battleship Yamato 2199 on Blu-ray Combo Pack and Star Wars Rebels: Season Four.
More...
July 30th, 2018
-1-News.jpg)
Isle of Dogs is the latest movie by Wes Anderson. It is a stop-motion animated film that had one of the best theater averages of the year during its opening weekend and is one of the best limited release hits of 2018. Is it also one of the best limited release hits? Or did it get by on star power?
More...
July 18th, 2018
-4-News.jpg)
It’s a shallow week in terms of the total number of releases, but a lot of films on this list are worth picking up. Rampage is the biggest and it is worth buying, if you are into popcorn action flicks. There are a lot of other releases that are worth picking up, but not quite Pick of the Week contenders, like Disobedience, The Good Place: Season Two, etc. As for true Pick of the Week contenders, we have a limited selection and I’m going with Isle of Dogs on Blu-ray Combo Pack for that title.
More...
May 23rd, 2018

The re-release of 2001: A Space Odyssey topped the theater average chart by a huge margin earning just over $200,000 in four theaters for an average of $50,690. The overall box office leader, Deadpool 2, was next with an average of $28,859 in over 4,000 theaters. First Reformed was right behind with an average of $24,391 in just 4 theaters.
More...
May 3rd, 2018

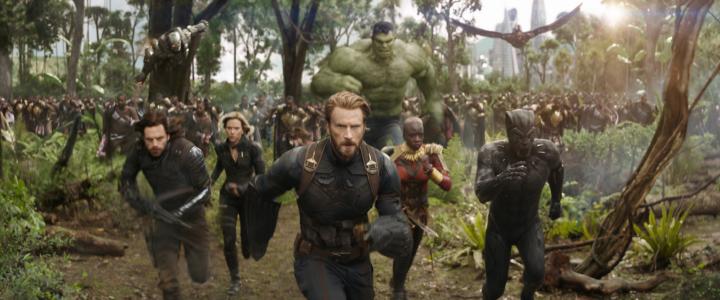
Avengers: Infinity War had the weekend’s best theater average at $57,599. However, this isn’t the best theater average of the year, as Isle of Dogs opened with an average of $60,011. Disobedience was close behind with an average of $47,479 in five theaters. The final film in the $10,000 club was Let the Sunshine In with an average of $19,850 in two theaters.
More...
April 25th, 2018
-2-News.jpg)
Ghost Stories was the only film in the $10,000 club earning $11,972 in its lone theater over the weekend. Bharat Ane Nenu did come close with an average of $9,180 in just over 300 theaters.
More...
April 24th, 2018
-6-News.jpg)
As expected, A Quiet Place returned to the first place with $20.94 million over the weekend. However, Rampage was much closer than expected with $20.09 million. It is on pace for $100 million domestically, assuming Infinity War doesn't reduce it to rumble this coming weekend. The new releases were led by I Feel Pretty, which came within a rounding error of expectations, while Super Troopers 2 beat expectations earning fourth place. Traffik barely made the top ten, but it could have been worse. Overall, the box office still fell 17% from last week, falling to $122 million. This is still 13% higher than the same weekend last year, which I was not expecting. I really thought The Fate of the Furious would earn more than the top two films earned this weekend, while the depth was also a lot better this week than I was anticipating. Year-to-date, 2017 is still behind 2018, by a 2.1% or $75 million margin at $3.43 billion to $3.51 billion. This should change this coming weekend. It better change.
More...
April 18th, 2018
-2-News.jpg)
Grace Jones: Bloodlight and Bami had the best opening of the limited releases earning an average of $18,724 in three theaters. The only other film in the $10,000 Club was The Rider, which earned an average of $14,081, also in three theaters.
More...
April 16th, 2018
-5-News.jpg)
Rampage was widely expected to earn first place over the weekend, and it did. However, A Quiet Place gave it a real run for its money and after Friday’s estimates, it looked like the horror film would repeat on top. Meanwhile, Truth or Dare was also a pleasant surprise at the box office earning close to $19 million on a $3.5 million production budget. Overall, the box office fell 9.8% from last weekend to $147 million. This is also 13% lower than the same weekend last year. That said, The Fate of the Furious opened this weekend last year and earned almost $100 million, so it could have been worse. Year-to-date, 2018 is still behind behind 2017 by $70 million or 2.0% or $3.27 billion to $3.33 billion.
More...
April 15th, 2018
-4-News.jpg)
Rampage isn’t exactly living up to its name this weekend, as it heads for a $34.5 million debut—just enough to keep A Quiet Place in second place, with $32.6 million in its second outing (down a very respectable 35% from its debut). As might be expected, international markets are proving friendlier to Rampage than the US and Canada, and it’s off to a healthy $114.1 million start in 61 territories, according to Warner Bros.’ Sunday morning estimate.
More...
April 14th, 2018
-3-News.jpg)
Rampage earned first place on Friday, barely, with $11.5 million. Its reviews slipped down to exactly 50%, but that’s still the best ever for a wide release based on a video game, and it earned an impressive A minus from CinemaScore. This adds up to a $32 million opening weekend. Unfortunately, the film cost $120 million to make and even more for its global P&A. And as we will see shortly, A Quiet Place was right on its tail on Friday. Fortunately, the film is doing better in some international markets. For example, it earned $15.6 million in China alone, with an early estimate of $21.2 million for Saturday.
More...
April 13th, 2018
-2-News.jpg)
Rampage started its box office run with $2.4 million during its Thursday night previews. This is almost $2 million lower than A Quiet Place managed last weekend, but last weekend was also Easter weekend, so a lot of the target audience had Friday off. Even so, this isn’t quite where I was hoping it would land when I made my prediction yesterday. $35 million is still possible, but it would take strong legs to get there. Fortunately, its reviews have continued to improve and the film’s Tomatometer Score is now 53% positive. According to this metric, it is the best wide release based on a video game of all time. This actually makes some sense. The original video game was based on movies like King Kong or Godzilla, so it should be able to inspire at least a passable version of those films.
More...
April 12th, 2018
-1-News.jpg)
Rampage is the biggest new release of the week and at one time it was widely assumed it would be the biggest hit of the month. Granted, this changed the second Infinity War moved up to an April release. However, now the film likely won’t even be the second biggest hit of the month, as A Quiet Place dominated last weekend. Truth or Dare has to deal with direct competition and that’s going to kill it. Finally, Isle of Dogs is expanding semi-wide. It likely won’t reach the top five, but it is already doing well for a limited release. This weekend last year, The Fate of the Furious opened with nearly $100 million. That’s about what the top four will earn this year. I can’t imagine 2018 coming ahead in the year-over-year comparison.
More...
April 11th, 2018
-1-News.jpg)
You Were Never Really Here was the clear winner on the theater average chart earning over $130,000 in just three theaters for an average of $44,276. This isn’t the best theater average for a film released in 2018, but it is in the top five. The overall number one film, A Quiet Place, was next with an average of $14,311. The final film in the $10,000 club is Lean on Pete, which earned an average of $11,744 in four theaters.
More...
April 3rd, 2018
-3-News.jpg)
For the second weekend in a row, Isle of Dogs led the way on the theater average chart with $17,839 in 165 theaters. The only other film to reach the $10,000 mark was Love After Love, which pulled in $11,290 in its lone theater.
More...
April 1st, 2018

The gulf between blockbusters and also-rans could hardly be starker these days. Since the release of Black Panther to a whopping $202 million on February 16, three movies that could have caught the general public’s imagination have arrived on the scene, and earned somewhere between a fifth and a seventh of that on opening weekend. Ready Player One is the most successful among them, with an opening of $41.2 million predicted by Warner Bros. as of this morning. That compares favorably to the openings of A Wrinkle in Time (which started out with $33.1 million), and Pacific Rim: Uprising ($28.1 million), and is, in fact, the best weekend in 2018 for a movie not called Black Panther, but it barely starts to chip away at considerable marketing costs, let alone a reported $150 million production budget.
More...
April 1st, 2018
Well, March has ended and it was a very disappointing month. Black Panther made more than any of the new releases did. The only potential big hit that didn’t miss expectations was Ready Player One. Because of this, 2018 lost its lead over 2017 and is now over $100 million behind last year’s pace. April is usually a terrible month, because it is a dumping ground, especially late in the month. No studio wants to compete with the first monster hit of the Summer. This year, the first monster hit of the summer, Avengers: Infinity War, opens in April. It will make more during its opening weekend than any other April release will make in total. It might make more opening day than any other April release will make in total. The only film that has a real chance to earn more than $100 million is Rampage, a video game adaptation. Last April, The Fate of the Furious earned more than $1.2 billion worldwide, but “only” earned $225.76 million of that domestically. Infinity War should earn more than that opening weekend. The second biggest hit of last April was Smurfs: The Lost Village and Going in Style, both of which earned $45.02 million. If 2018 doesn’t retake the lead by the end of the month, then 2018 is in trouble at the box office.
More...
March 27th, 2018
-2-News.jpg)
Isle of Dogs had the best theater average of the weekend and indeed the year with an average of $59,825 in 27 theaters. Technically Fantastic Mr. Fox had a better average with $66,475, but it was only playing on 4 theaters, so this is much more impressive.
More...
March 25th, 2018

Black Panther’s run at the top of the domestic chart will finally come to an end this weekend, with Pacific Rim: Uprising taking over as the most popular film in the US and Canada. The switch over is mostly due to Panther beginning to run out of steam, rather than Uprising showing any particular strength though. Universal’s sci-fi action movie will pick up $28.005 million over its opening weekend in North America, about in line with expectations, but disappointing for a film that cost $150 million to make. Overseas markets, particularly in Asia, are where the box office action is at for this one.
More...
March 24th, 2018

As expected, Pacific Rim: Uprising earned first place on Friday. In fact, its opening day box office of $10.36 million is actually a little better than expected and it is on pace for a $26 million opening weekend. Granted, this is a terrible opening compared to the film’s production budget, which is reportedly in the $155 million to $175 million range. Neither its reviews, nor its B-rating from CinemaScore will help its legs, but this film was never made to win over domestic audiences. It was made to shine in Asia, specifically China. It is too soon to tell for sure if that’s a viable strategy, or if Universal is going to have to suck up massive losses. Based on Friday numbers, the studio is predicting a $65 million opening weekend China alone and a $120.5 million international debut. That’s obviously better than here, but the film will need at least $400 million internationally to break even any time soon.
More...
March 23rd, 2018
There are over two dozen limited releases coming out this week, but many of them had only a handful of, if any, reviews. There are some that should find a receptive audience, whether its on Video on Demand like Pyewacket, or whether it has massive breakout success, like most think Isle of Dogs will manage.
More...
March 1st, 2018

February was an amazing month, thanks mainly to Black Panther, but Fifty Shades Freed and Peter Rabbit were also significant hits and overall the month was a massive improvement over last February. Looking forward, there’s nothing opening in March that will earn as much in total as Black Panther did during its opening weekend. That said, A Wrinkle in Time and Ready Player One should have no trouble getting to $100 million, while Tomb Raider has a 50/50 chance of getting there. Unfortunately, compared to last March, this is still a pittance. There’s a chance that no film opening this March will earn as much in total as Beauty and the Beast opened with last march. We will need Black Panther to have good legs to keep 2018 ahead of 2017 by the end of the month.
More...
September 22nd, 2017
Animated adventure written and directed by Wes Anderson, with the voices of, among many others, Bill Murray, and Edward Norton opens March 23, 2018 ... Full Movie Details.
More...
.jpg)