January 9th, 2019
-2-News.jpg)
Directors Guild of America announced their theatrical nominations this week and we are starting to see some real patterns emerge and I think the Oscar picture is getting clearer.
More...
December 13th, 2018
-1-News.jpg)
The first instalment of our Holiday Gift Guide dealt with First-run Releases and the second instalment with, TV on DVD releases. The third installment of our Holiday Gift Guide deals with limited releases, classics, and foreign imports and this list can get out of hand rather quickly, so I will try and keep it to a dozen items or so, starting with...
More...
November 17th, 2018

The Independent Spirit Awards nominations were announced on Friday and thus the 2018 Awards Season begins. We The Animals topped the list with five nominations, while A24 earned 12 as a studio.
More...
October 24th, 2018
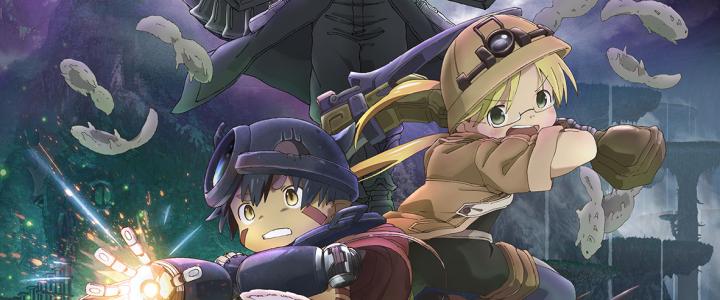
It is a slow week on the home market, as Mamma Mia: Here We Go Again! is the only first run release. There are several horror films that are selling well enough to be worth talking about, but that is all. As far as the best of the best are concerned, the two I’m most interested in and I put in requests for screeners for both are BlacKkKlansman and Incredibles 2, but they are only coming out on VOD this week. I don’t like handing out Pick of the Week titles to VOD releases, so the real race is between The Americans: The Complete Final Season and Made In Abyss: Season One. Both are worth picking up, but I think there will be a full series Megaset for The Americans, so I’m giving the title to Made In Abyss.
More...
October 9th, 2018
It’s not a bad week on the home market. The two biggest releases, Hotel Transylvania 3: Summer Vacation and Skyscraper, are both worth checking out, but not close to being Pick of the Week contenders. As for the best of the best, Eighth Grade is really the only choice, while Thelma Todd & Zasu Pitts: The Hal Roach Collection was the runner up. Killing Eve: Season One and Recovery of an MMO Junkie: The Complete Series could have been contenders, if they had significant extras.
More...
August 16th, 2018
-1-News.jpg)
Skate Kitchen and Madeline’s Madeline had nearly identical openings earning $18,605 and $18,009 respectively. Both films were playing in only one theater a piece. The only other film in the $10,000 club was The Meg at $11,025.
More...
July 25th, 2018
Eighth Grade remained on top of the theater average chart with an average of $24,975 in 33 theaters over the weekend. McQueen and Blindspotting were right behind with averages of $24,718 and $24,024 in 4 and 14 theaters respectively. The re-release of Wanda opened with $10,679 in one theater. The two wide releases of the week were next with The Equalizer 2 and Mamma Mia: Here We Go Again! in a virtual tie at $10,629 and $10,537 respectively.
More...
July 18th, 2018
Eighth Grade had the best theater average of the year with $65,949 , topping the previous champ, Isle of Dogs, by nearly 10%. On the other hand, Isle of Dogs opened in 27 theaters vs. 4 for Eighth Grade. Second place went to Don’t Worry, He Won’t Get Far on Foot with an average of $20,835 in four theaters. The only other member of the $10,000 club was the overall box office leader, Hotel Transylvania 3: Summer Vacation, which pulled in an average of $10,629.
More...
July 17th, 2018
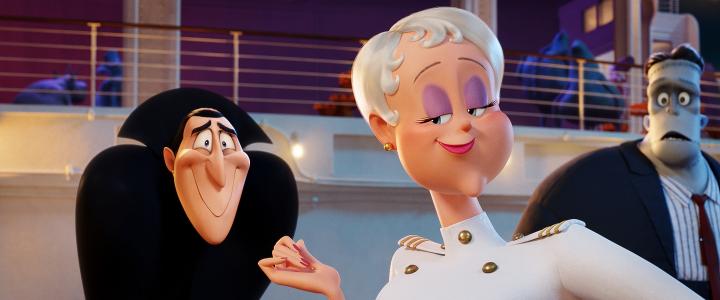
The weekend wasn’t nearly as close as expected. Hotel Transylvania 3: Summer Vacation ran away at the box office, while fellow new release, Skyscraper, only managed third place. This did allow Ant-Man and the Wasp to earn second place during its second weekend of release. Overall, the box office fell 12% compared to last weekend, but it was 1.6% higher than the same weekend last year. Granted, this is not a high enough margin of victory to compensate for ticket price inflation, but 2018 has such a large lead that even a small victory like this is more than enough to feel good about the overall box office. Speaking of large leads, 2018’s lead over 2017 remains impressive at $550 million or 8.9% at $6.72 billion to $6.17 billion.
More...
July 14th, 2018

Hotel Transylvania 3: Summer Vacation easily won the box office race on Friday with $16.65 million during its opening day. This is a bit better than expected and puts it on pace for an opening weekend of $44 million, including special previews that took place June 30th. Its reviews are just below the overall positive level, while it managed an A minus from CinemaScore. That’s as low as a family film can go before it would hurt its legs. It should get to $100 million domestically without difficulty, but it won’t match the previous films in the franchise. It will break even and could even justify a fourth film.
More...
July 12th, 2018

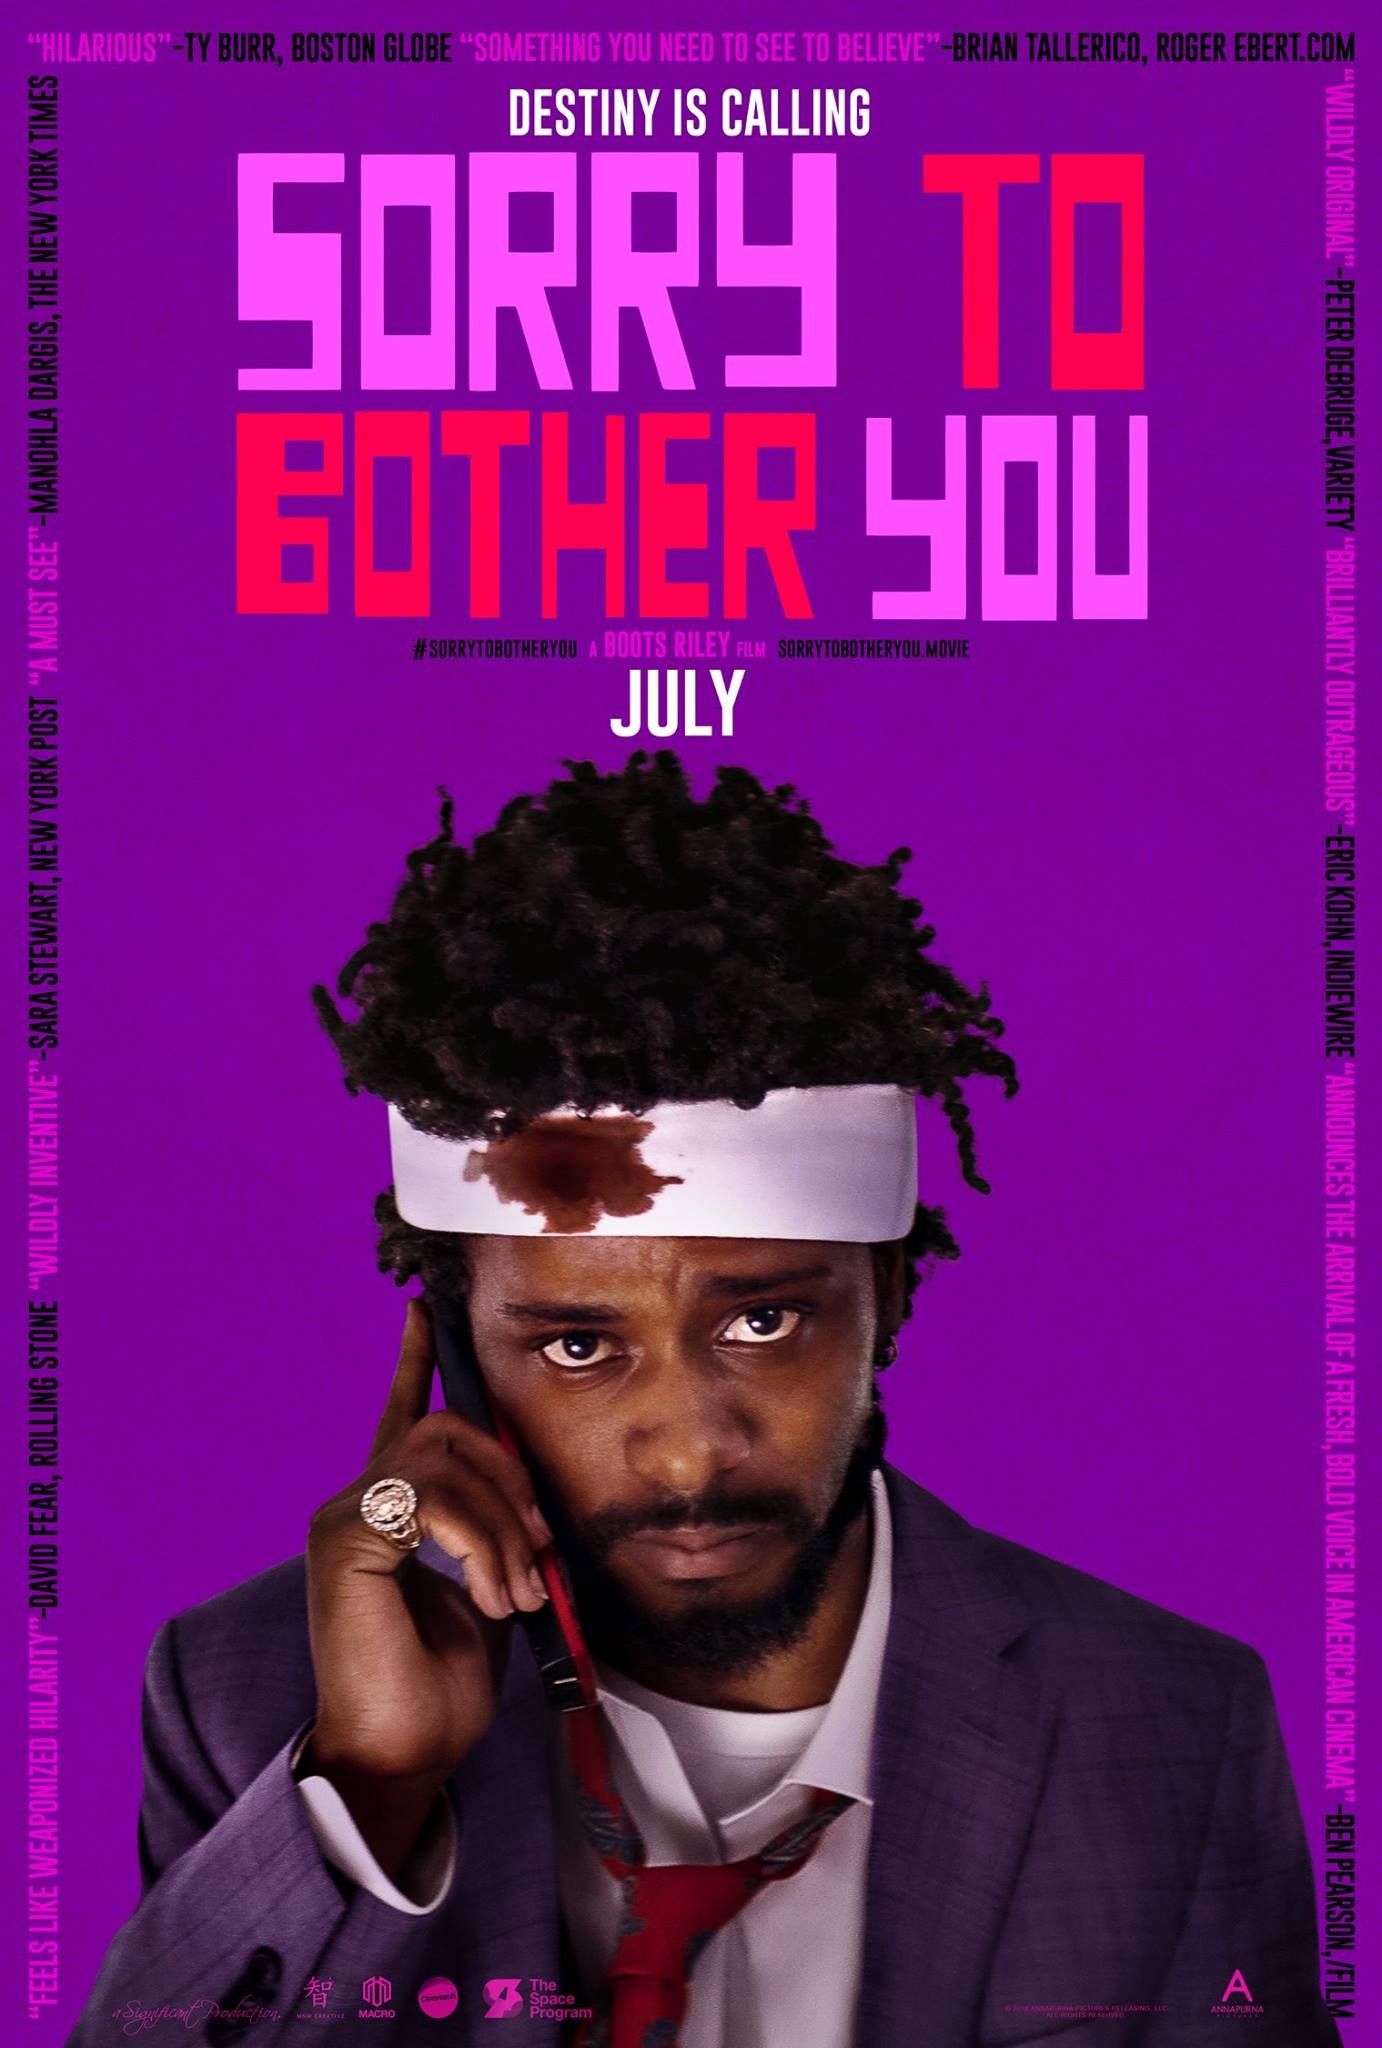
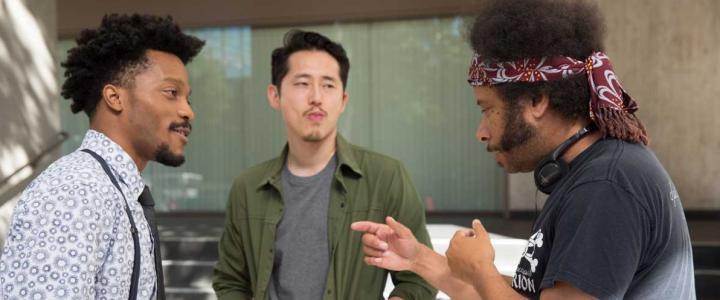
Sorry to Bother You dominated the theater average chart this week with an average of $45,454 in 16 theaters. As I previously mentioned, this is the sixth-best opening average for a limited release this year. Ant-Man and the Wasp earned top spot on the weekend chart and second place here with an average of $18,025. Three Identical Strangers remained in the $10,000 club with an average of $13,427 in 51 theaters and should have no trouble expanding further. Ryuichi Sakamoto: Coda earned $12,827 in its lone theater, which is excellent for a documentary. Leave No Trace remained in the $10,000 club with an average of $10,892 in 37 theaters. It will continue to expand.
More...
July 8th, 2018
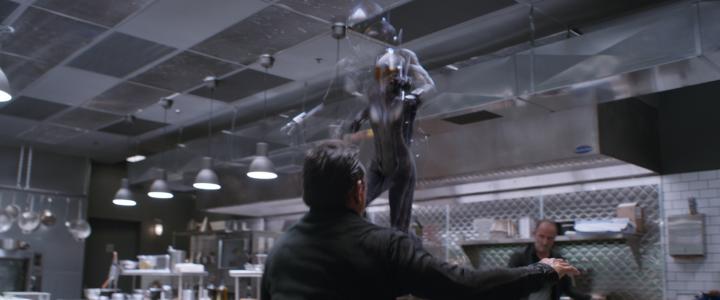
Ant-Man and the Wasp did not have as good a Saturday as hoped, and this has left it with a projected $76.03 million over the weekend, according to Disney’s Sunday morning estimate. While, this is more or less in line with original predictions, it is lower than previews and Friday estimates suggested. Fortunately, with great reviews and an A minus from CinemaScore, it should have legs long enough to get to $200 million domestically, with a little help from the studio. This would be a little more than a 10% increase from the first Ant-Man. Internationally, the film opened with $85 million in 41 markets, including a monster opening in South Korea. The film managed $20.9 million debut there, including previews, which was 78% higher that the first film’s opening in that market. Overall, the film saw 45% growth internationally compared to just under 33% growth here.
More...
July 6th, 2018
It’s a short week for limited releases; however, that doesn’t mean there’s nothing to talk about. Sorry to Bother You is earning some of the best reviews of the week and it has the loudest buzz. Meanwhile, Whitney is playing in over 450 theaters and could reach the top ten.
More...
July 1st, 2018

June was amazing, with two absolute monster hits and a solid $100 million hit. By the end of the month, 2018’s lead over 2017 will be well over $500 million, or close to 10%. Even if 2018 only managed to maintain this lead in terms of raw numbers for the rest of the year, it will be a massive jump at the box office. As for July, there are a couple of potential monster hits, Ant-Man and the Wasp and Mission: Impossible—Fallout, plus four potential $100 million hits. Last July, there was only one monster hit, Spider-Man: Homecoming, and three $100 million hits. I don’t think 2018 will match 2017 at the top, but 2018 appears to have more depth and that should put it a little ahead over the full month.
More...