March 6th, 2012
The number of big releases coming out this week can be counted on the fingers of one hand. The biggest theatrical release of the week is Immortals, but its reviews were weak enough that I think it might struggle on the home market in comparison. There are also a few catalog titles coming out on Blu-ray that are note-worthy, like To Catch a Thief. However, by far the biggest release, and the best, is Game of Thrones: Season One on DVD or Blu-ray, the latter of which is the Pick of the Week with To Catch a Thief not too far behind.
More...
March 1st, 2011
President's Day sales boosted a number of holdovers back into the top 30 on this week's sales chart. However, it was a new release, Unstoppable, that led the way with 796,000 units sold for opening week sales of $12.73 million.
More...
February 13th, 2011
With our annual Oscar Prediction contest underway, now is the best time to look at the nominees and try and figure out who the favorites are and which films should just feel honored to be nominated. This weekend we will look at the four acting categories, with Best Supporting Actor, which is a two-horse race, if you want to be very generous.
More...
January 25th, 2011
The Oscar nominations were announced this morning, thus ending months of speculation. Along with a (very) few surprises, the list of nominees is mostly a case of Deja Vu. Leading the way, as it has so often this year, was The King's Speech, with 12 nominations, including six in seven of the most prestigious categories (Best Picture, Director, Screenplay, and the four acting categories). But it was far from the only multi-nominated film on the list.
More...
January 11th, 2011
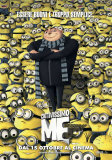
Only two new releases charted this week, and only one of them could lay claim to top spot. That DVD was Resident Evil: Afterlife, which sold 576,000 units and generated $9.86 million in opening week sales. On the other hand, Despicable Me could also legitimately claim first place with $9.98 million in revenue from 565,000 units. So far that film has sold 5.73 million DVDs for $96.82 million in total sales.
More...
January 4th, 2011
Producers Guild of America announced the nominations in seven categories, three of which are for theatrical releases. Like last year, there was only one repeat nominee, and again like last year, it was a Pixar release.
More...
January 4th, 2011
WGA nominations were announced this week, and there were some strange results, as the guild is sticking to their rules, which resulted in a number of possible Oscar contenders being ruled ineligible. That said, of the non-documentary films, only one hasn't picked up a single nomination previously, so it is hard to say this list is too out there.
More...
December 28th, 2010
There were seven new releases to chart this week, including the new number one. In fact, that new number one dominated in a surprising way and none of the other new releases managed to make much of an impact at the box office. Despicable Me led the way with 3.75 million units sold and $62.70 million. If there were any doubts about a sequel, this ended them, as the film is already in the top ten for the year.
More...
December 21st, 2010
It's the last chance for Christmas gifts, although if you have to order online, you better choose the overnight option. Or do what I do, tell them you pre-ordered it and it will arrive a little late. One of the gifts I'm giving this year is being sent from Japan via boat. It might not get here till February, but the person I'm giving it to knows and they're cool with that. Anyhoo, if you are looking for good gifts, Easy A on Blu-ray is the best reviewed wide release of the week, while geeks would be happy with Family Guy: Laugh It Up, Fuzzball on Blu-ray for Futurama: Volume Five on Blu-ray. However, this week the Ultimate Geek Gift and Pick of the Week is The Guild: Season Four.
More...
December 17th, 2010
The SAG nominations were handed out this week, and while there were a couple of interesting notes, overall there was a decided lack of surprises. The King's Speech and The Fighter led the way with four nominations each, while Black Swan and The Kids Are All Right were right behind with three. All four have been considered Awards Season players for a long time, so their success with SAG merely confirms that and is not shocking in the least.
More...
December 14th, 2010
The Hollywood Foreign Press Association announced their nominations early this morning, and there are some interesting surprises included in the mix. Leading the way was The King's Speech, which has long been seen as one of the major players this Awards Season. Meanwhile, The Fighter and The Social Network were right behind with six each. There were many, many other films nomination, including more than a few shocks. ... Mostly in one category.
More...
December 13th, 2010
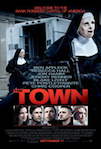
This week we have the last of the major summer blockbusters hitting the home market, and not only did Despicable Me earn $250 million domestically and more than $500 million worldwide, it also earned amazing reviews. This makes it an obvious contender for Pick of the Week. Unfortunately, the screener is late, and I hate to award that honor to a release when this is the case. As far as its competition is concerned, there are two main releases vying for that title: The Quintessential Guy Maddin! on DVD and The Town on Blu-ray. Despite my well-documented pro-Canada bias, I'm giving it to the latter.
More...
October 31st, 2010
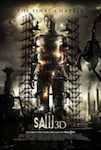
With an estimated 92% of box office receipts coming from 3D shows, Saw 3D became the highest-grossing horror franchise in history this weekend, overtaking Friday the 13th.
Its $22.4 million opening is still down from the peak for the franchise, which topped $30 million on four occasions, but is up significantly from the disappointing $14.1 million debut of Saw VI last year.
(See full franchise history here.)
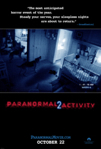
Paranormal Activity 2, meanwhile had a steep drop to $16.5 million in its second weekend, although 59% isn't terrible for the genre, and the low-budget sequel has racked up over $65 million in just 10 days.
More...
October 27th, 2010
Mirroring its domestic debut, Paranormal Activity 2 opened in first place internationally with $22.32 million on 2752 screens in 21 markets. The film opened in first place in the U.K. with $5.92 million on 389 screens, while it also topped the charts in Australia with $2.68 million on 185 screens and in Mexico with $1.86 million in 452. On the other hand, it had to settle for second place in South Korea with $1.05 million on 218 screens over the weekend and $1.18 million in total. While in Italy it could do no better than fourth place with $1.55 million on 250.
More...
October 20th, 2010
Despicable Me completed its climb to the top of the international chart with $27.03 million on 4751 screens in 40 markets for totals of $170.27 million internationally and $417.32 million worldwide. This week's openings include the U.K., where it topped the chart with $5.81 million on 522 screens, which is a good result, but not a great result. It placed second in Italy with less money at $4.86 million on 544 screens, but ironically, this is a better result due to the relative size of the two markets and it only placed second due to a massive local hit. Meanwhile, the film was down just 23% in France adding $3.57 million on 657 screens for a two-week total of $8.82 million. It was down 35% in Spain, but remained in first place with $2.25 million on 542 screens over the weekend and $8.27 million in total. The film is running out of places to open in, but by this time next week it should have $200 million internationally, while $500 million worldwide is still the main goal.
More...
October 7th, 2010
There could be a real tight race for top spot at the box office this week, which is good news as it gives us something to talk about while we avoid the year-over-year comparison. There are three wide releases coming out this week; however, it is very possible that their combined opening weekend results will be less than last year's number one film, Couples Retreat. Even if 2010 avoids that fate, there's almost no chance it will keep up with last year's pace.
More...
October 4th, 2010
October started in such a way that it feels like September was extended a weekend. The top film wasn't bad, but the other two wide releases bombed. Overall the box office brought in $95 million, which was down 6% from last week and 11% from the same weekend last year. 2010 is still ahead of 2009 by 4% at $8.19 billion to $7.90 billion, but if it were to lose 11% each weekend, that lead would evaporate by the end of the year.
More...
September 30th, 2010
It's the beginning of October, so it should come as no surprise there are a couple of horror films are coming out. More surprisingly, a couple of films released this week are also earning Oscar- or near Oscar-worthy reviews.
(There's only three films, so there's some crossover.)
Direct competition between the films could hurt, but hopefully not so much that 2010 falls behind last year's pace.
It's not like last year was explosive at the box office, as Zombieland just missed $25 million at the box office, and it was the clear winner.
Will any of the wide releases top that figure? And will the overall box office help 2010 maintain its lead over 2009?
More...
September 29th, 2010
Another week, another milestone for Resident Evil: Afterlife, this time crossing $200 million worldwide, which makes it the first in the franchise to do so. Over the weekend it led the international box office with $25.20 million on 6519 screens in 55 markets for a total of $154.71 million internationally and $206.78 million worldwide. It managed top spot during its debut in France with $2.96 million on 408 screens, but that's below average for its run so far. Meanwhile, it added $2.87 million on 633 screens in Japan for a total of $38.51 million after three weeks of release there. That's almost as much as Inception has made in that market, and its been there for ten weeks.
More...
September 27th, 2010
While none of the three new releases were able to live up to expectations, the holdovers did more than just hold their own, which helped the overall box office pull in $101 million over the weekend. This was nearly identical to last week, while it was higher than the same weekend last year by 4.5% and that helped 2010 maintain its lead over 2009. Currently 2010 is ahead of 2009 by a nearly 4% margin at $8.07 billion to $7.76 billion. Losing a $300 million lead in just three months would be impressive in its ineptitude, but we can't be too quick to claim victory. After all, Avatar made almost as much during the last two weeks of 2009 and there's nothing opening for the rest of 2010 that can compensate for that much at the box office.
More...
September 23rd, 2010
It's the final weekend of September and there are three and a half new releases this week looking to cash in. We could have a race for the top, as two films, Legend of the Guardians and Wall Street 2 are both vying for top spot. It might be close enough that one could win Friday night at the box office, while the other wins the weekend as a whole. Or perhaps one will win opening weekend, while the other will finish its box office run with more. Either way, combined they should help 2010 keep pace with last year, which didn't exactly have a strong crop of new releases.
More...
September 20th, 2010
It was a good news / bad news weekend at the box office. On the one hand, the overall numbers bounced back from last weekend up 23% to $101 million. On the other hand, they were down from the same weekend last year, albeit by less than 1%. Year-to-date, 2010 still has a lead on 2009 at $7.94 billion to $7.64 billion. As long as 2010 can avoid double-digit declines from now till the rest of the year, it should finish with the lead, at least in terms of raw dollars. On the other hand, it is behind in ticket sales by 1.7%, and I don't know if it will be able to turn that around.
More...
September 19th, 2010
The Town kept up September's decent run at the box office by delivering an higher-than-expected $23.8 million weekend and winning the weekend, according to Warner Bros. Sunday estimate.
With three other wide openers delivering reasonable numbers, this weekend looks as though it will be up overall from last year, in spite of having to compete with the opening of Cloudy with a Chance of Meatballs.
More...
September 16th, 2010
After Resident Evil: Afterlife had the new release schedule all to itself last weekend, this weekend we have four wide releases making their debuts. However, thanks in part to the competition, none look to be particularly strong and there will likely be a sizable drop-off at the top of the chart. On the other hand, they should do well enough combined to help the box office grow and perhaps even keep pace with last year.
More...
September 1st, 2010
Summer has ended and while there were some bigger than expected hits in August, this trend is unlikely to continue in September. There are four weekends this September and nearly a dozen films opening wide, plus a few more that may or may not open wide. Of all of those films, maybe three of four will be midlevel hits, while only one film, Legend of the Guardians: The Owls of Ga'Hoole 3D, has a real shot at reaching the $100 million milestone. This is compared to last year when we had two $100 million hits, although one of those was Paranormal Activity, which didn't expand truly wide till Halloween. Hopefully 2010 can gain ground on 2009 overall, even if it doesn't have as many $100 million hits.
More...
October 2nd, 2008
This week's round of new casting information contains updates for Paper Man, Sherlock Holmes, Kung Fu Panda 2, and more!
More...
September 30th, 2008
This week another number of upcoming movies, new stars and directors have been added to our archive!
More...