November 17th, 2018

The Independent Spirit Awards nominations were announced on Friday and thus the 2018 Awards Season begins. We The Animals topped the list with five nominations, while A24 earned 12 as a studio.
More...
September 4th, 2018

Like last week, this week is rather busy on the home market with many more TV on DVD releases. There are not a lot of big releases this week, nor are there a lot of contenders for Pick of the Week. It’s really a two-horse race between Won’t You Be My Neighbor? and New Game!!: Season Twp. Won’t You Be My Neighbor? on Blu-ray won that race rather easily.
More...
August 20th, 2018
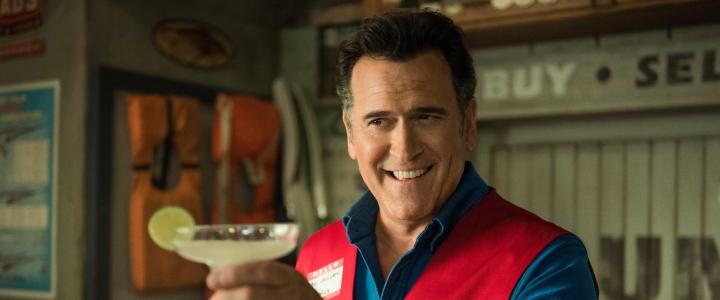
It’s a good week on the home market as we not only have a monster hit that is worth being a Pick of the Week contender, Deadpool 2, we have a wide selection of other contenders. This includes a limited release, First Reformed; an Anime title,Sakura Quest: Part Two; as well as a TV on DVD release, Ash vs. Evil Dead: Season Three. In the end, I went with Ash vs. Evil Dead: Season Three, but it was a close race.
More...
June 18th, 2018

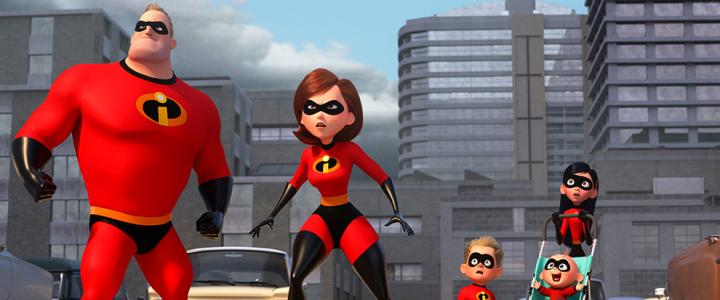
Incredibles 2 became the first potential monster hit since Infinity War to beat tracking numbers, opening with a mind-numbing $182.69 million. It is hard to describe how amazing this opening is. It has rewritten the record book when it comes to animated films and it gives Disney the top three openings of 2018 and four of the top five. This is twice as much as the rest of the box office earned over the entire weekend. There were other new releases this week, with Tag doing fine. Its $14.95 million opening is nothing special, but it should break even sometime on the home market. SuperFly, on the other hand, was a disappointment. The overall box office grew by 126% from last weekend, with Incredibles 2 earning about 50% more than the entire box office pulled in last weekend. The film was just shy of the same weekend last year, while the overall box office rose by 43%. Year-to-date, 2018 continues to have a lead over 2017, and it has grown to a commanding lead of 6.6% or $340 million at $5.44 billion to $5.10 billion. Granted, we are barely halfway through the year, but 2018 is in a great position to break the all-time yearly box office record.
More...
June 12th, 2018
-5-News.jpg)
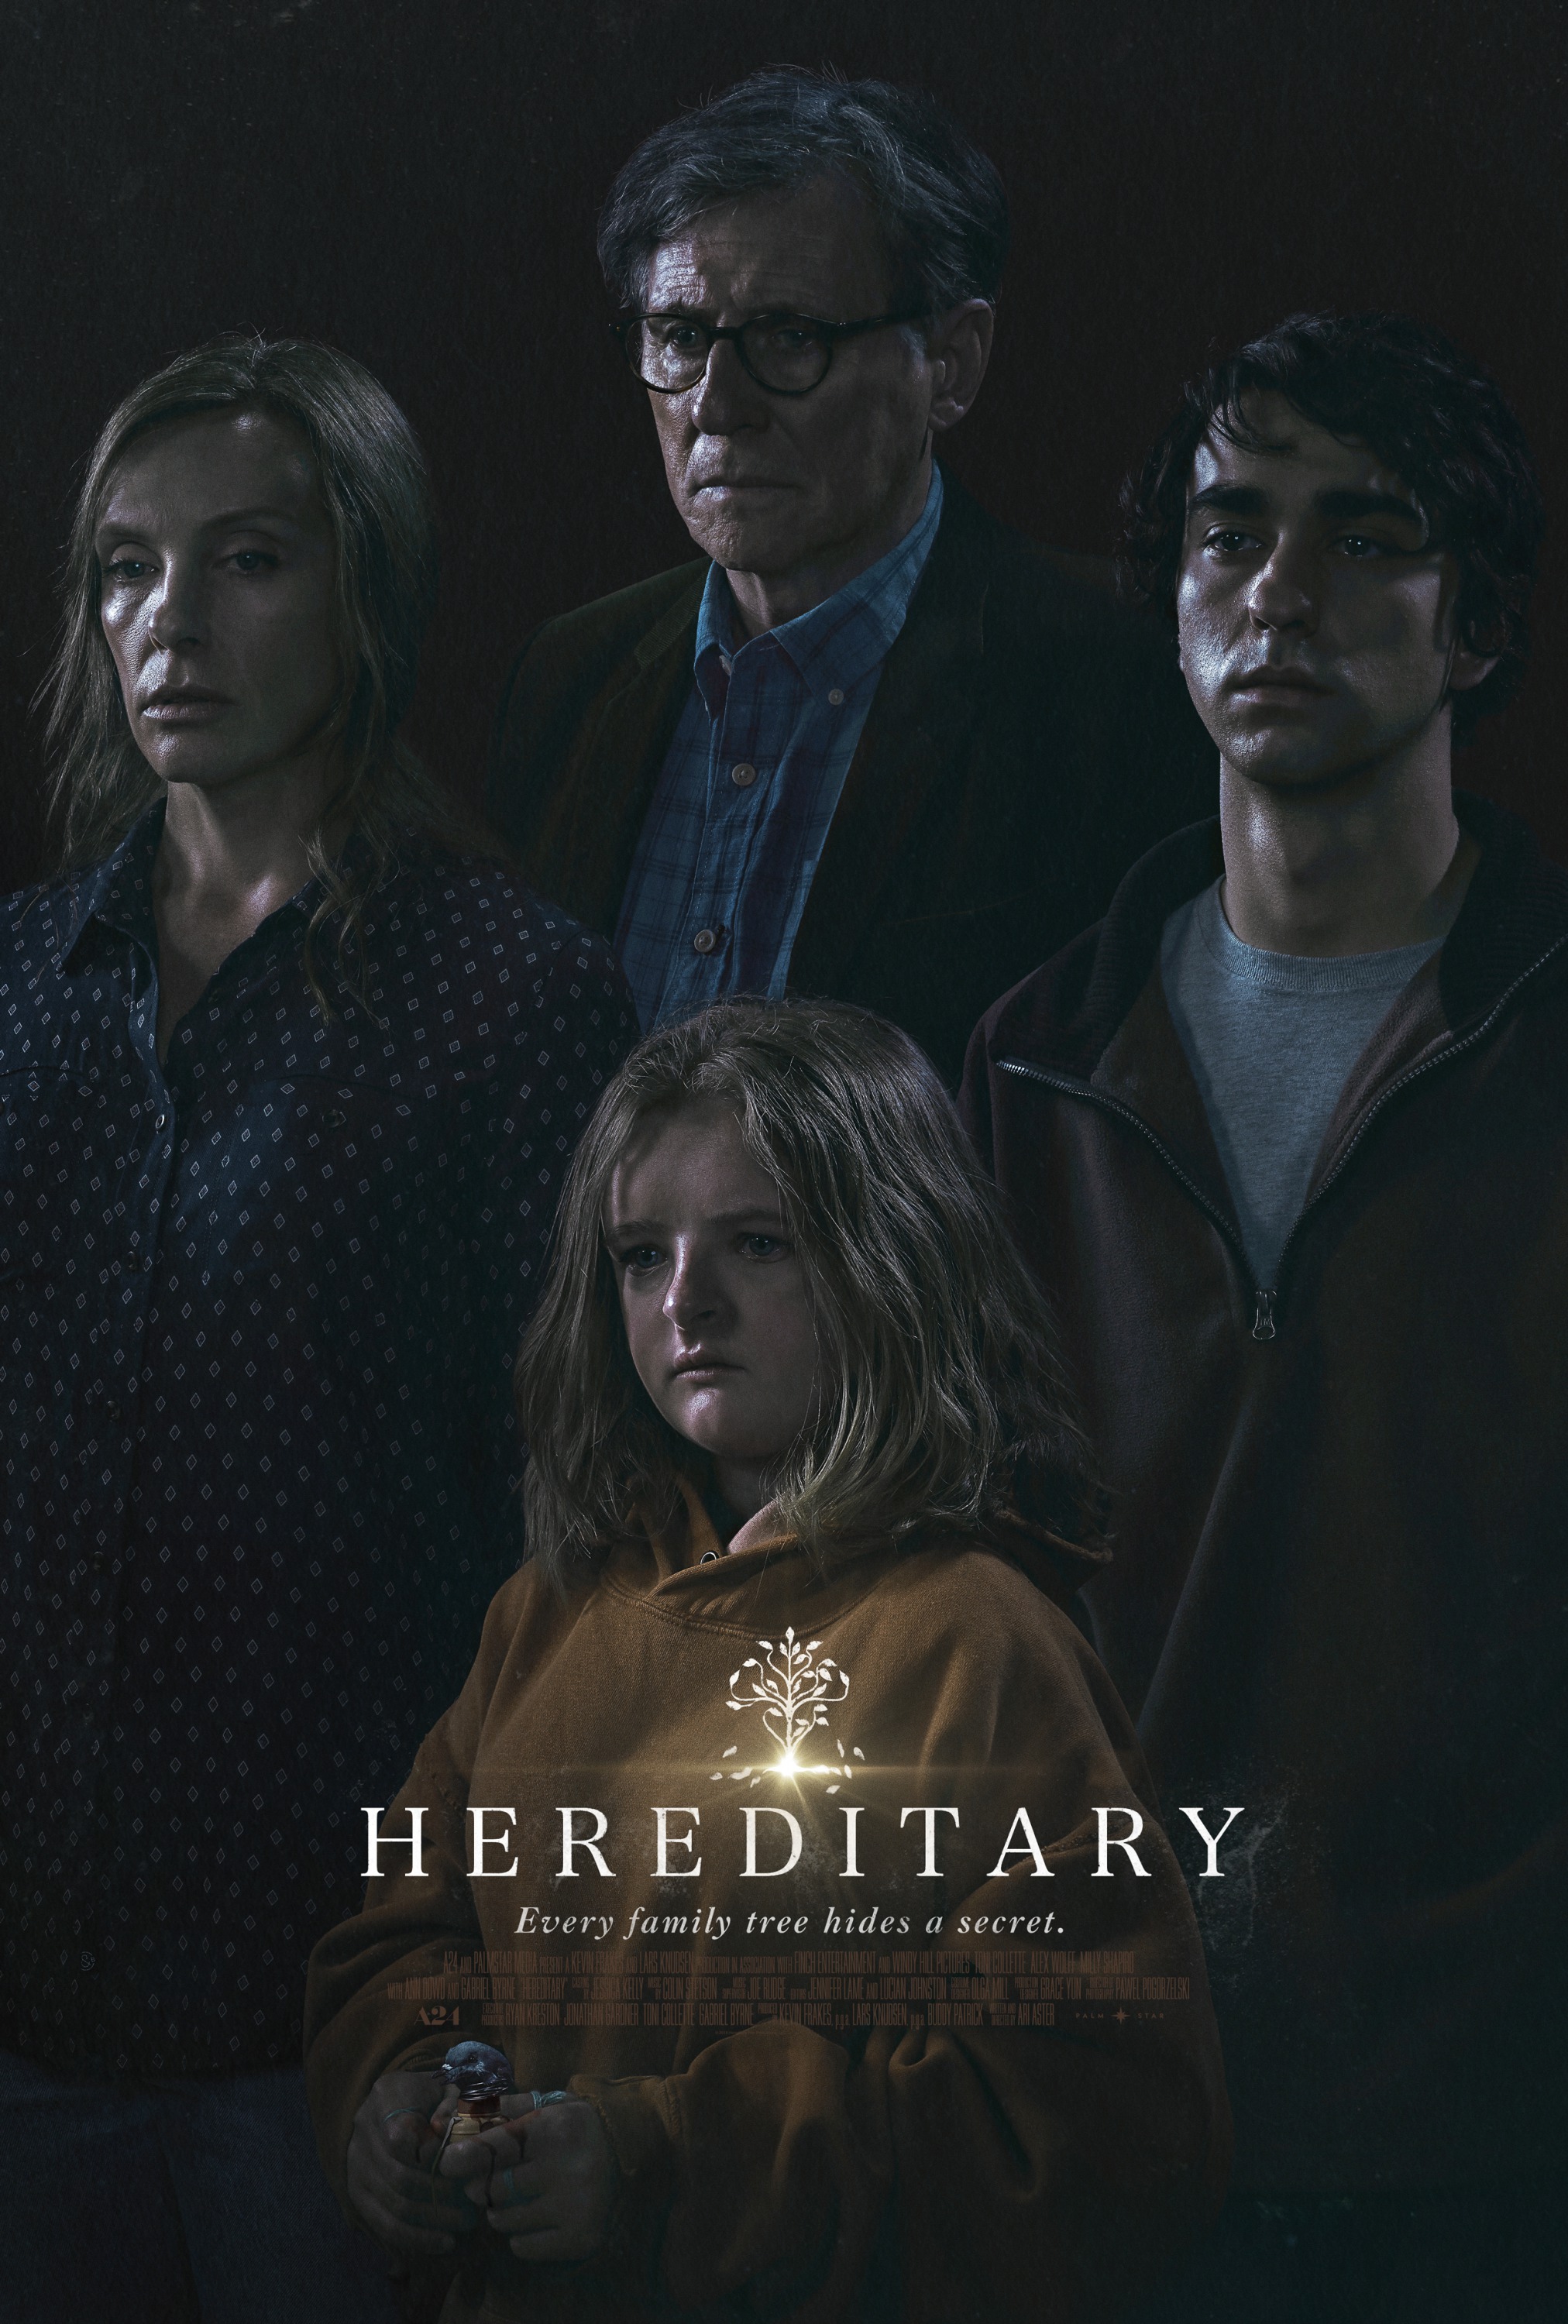
The weekend was very kind to Ocean’s 8, as it opened with $41.61 million. This is not only the top result this weekend, it is the best opening weekend in the franchise. Hereditary also opened on the high end of expectations, leaving just Hotel Artemis as the only disappointment of the weekend. Overall, the box office rose 13% from last weekend to $120 million. More importantly, this was 17% lower than the same weekend last year. That said, it could have been worse and 2018 still has a 5.1% / $250 million lead over 2017 at $5.11 billion to $4.86 billion.
More...
June 10th, 2018
-4-News.jpg)
Ocean’s 8 matched expectations with $41.5 million over the weekend. If it can maintain this figure, then it will open in the $10,000 club, while even if its final numbers slips a little, it still would be on pace for $100 million domestically. Its reviews have settled to 67% positive, and it managed an acceptable B plus from CinemaScore, so its legs should be average. Fortunately, with a start like this, it only needs average legs to break even early in its home market run.
More...
June 9th, 2018
-3-News.jpg)
Two of the three new releases opened well on Friday. Ocean’s 8 open with $15.8 million, putting it on pace for an opening weekend of $42 million. This is the best opening in the franchise. It is also the cheapest installment in the franchise with a $70 million production budget, so it won’t need amazing legs to break even during its initial push into the home market. Its reviews are 69% positive, while it earned a B plus from CinemaScore. Neither of those results are particularly good, but they are no reason to panic either. Unfortunately, it won’t have the same legs as its predecessors, as the market has changed in the past decade. Furthermore, films with predominately female casts don’t do as well internationally, so the film will rely a little more on its domestic numbers to break even. That said, Warner Bros. should be happy with this result.
More...
June 8th, 2018
-2-News.jpg)
Ocean’s 8 opened with $4 million during its previews. By comparison, the most recent gender-bent remake, Ghostbusters, earned $3.4 million during its previews on its way to a $46.02 million opening weekend. The two films also have very similar reviews, so they could have similar legs. However, we have seen a number of films over-perform during previews only to come back down to earth over the weekend, so I’m not willing to change our $40 million prediction, at least not yet.
More...
June 7th, 2018
-1-News.jpg)
Ocean’s 8 leads a trio of new releases this week and it might be the only one to reach the top five. It is certainly the only one competing for first place. Hereditary is earning amazing reviews, but it is an art house horror movie and those tend to struggle at the box office. Finally there’s Hotel Artemis, which is earning the quietest buzz of the three releases. Solo: A Star Wars Story and Deadpool 2 should remain strong helping the overall box office. However, while this year’s new releases are better than last year’s new releases, with Wonder Woman’s sophomore stint, 2018 is going to suffer another loss. Next week will be better.
More...
June 1st, 2018
This May was an odd month, as Avengers: Infinity War opened on the last weekend of April, rather than the first weekend of May. This meant May started out slowly, but Deadpool 2 and Solo: A Star Wars Story did well enough to give 2018 a healthy lead over 2017. Looking forward, there are two potential monster hits this month, Incredibles 2 and Jurassic World: Fallen Kingdom, and another $100 million hit, Ocean’s 8. Last June, there were four $100 million hits, led by Wonder Woman, which pulled in over $400 million. I think 2018 and 2017 will be an even match at the top, so 2018 will have to rely on depth to improve upon its lead over 2017.
More...
May 29th, 2018
Horror movie starring Toni Collette opens June 8 ... Full Movie Details.
More...