August 13th, 2020

The Tax Collector pulled off a double-win last week by earning first place on the weekend box office chart and the DEG Watched at Home chart. Hopefully this will never happen again, because the pandemic will not last long enough for another film to get the chance.
More...
September 19th, 2018
-1-News.jpg)
This week, Jurassic World: Fallen Kingdom is coming out on DVD, Blu-ray Combo Pack, 3D Combo Pack, or 4K Combo Pack and not surprisingly, it is scaring away the competition and it is the only significant first-run release of the week. Unfortunately, it is not a Pick of the Week contender, so we have to look to smaller releases My Man Godfrey is a classic and Supergirl: Season Three is still fun. There are also some Anime titles worth considering, including Saga of Tanya the Evil: The Complete Series and Gosick: The Complete Series. It was close, but My Man Godfrey won in the end.
More...
September 17th, 2018
-4-News.jpg)
I hated Jurassic World and Jurassic World: Fallen Kingdom actually earned weaker reviews, so I was apprehensive about reviewing this film. On the other hand, while the film’s Tomatometer Score was lower, as was its box office, I’ve heard some people say this is the better film. Am I going to be pleasantly surprised? Or will this be the last time I bother with this franchise?
More...
August 21st, 2018
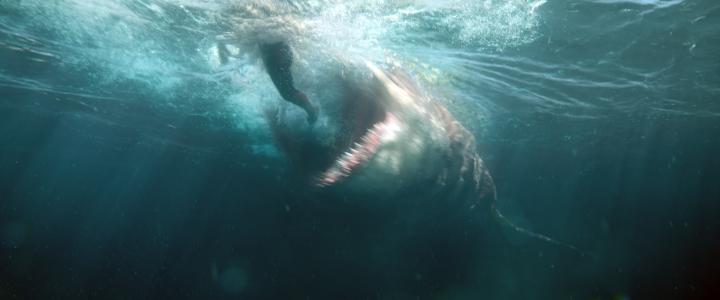
The Meg remained in first place on the international chart with $68.9 million on 23,767 screens in 55 markets, for totals of $232.2 million internationally and $316.0 million worldwide. Its biggest new market of the weekend was Australia, where it earned first place with $2.48 million on 413 screens. It also opened in South Korea, but struggled with $1.57 million on 598 screens over the weekend for a total opening of $3.19 million. Its biggest market overall was China, where it added $30.78 million over the weekend for a two-week total of $117.09 million. It fell just 38% during its sophomore stint, while it actually rose to second place, despite there being four new releases in the top ten. That’s stunning.
More...
August 16th, 2018
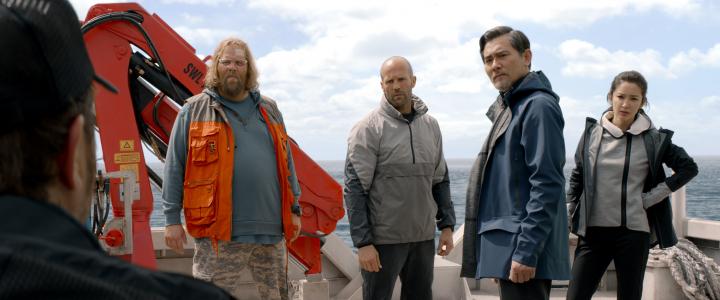
The Meg led the way on the international chart cracking the century mark with $101.5 million on 30,212 screens in 42 markets and a worldwide opening of $146.9 million. This is great news, and the film cost Warner Bros. $130 million to make, after tax rebates and the like, so the film needed a monster opening to break even any time soon. The film’s biggest market was China, where it earned $49.83 million on 16,307 screens. It only managed third in that market, but it was a very busy weekend with two massive local hits also debuting this weekend. The film was able to top the charts in Mexico with $6.30 million on 1,936 screens and in Russia with $5.48 million on 2,628. It wasn’t as potent in the U.K., but it still topped the chart with $4.66 million in 499 theaters. The film has yet to open in South Korea, Australia, France, and Japan, so it should stick around the top five for a bit.
More...
August 8th, 2018
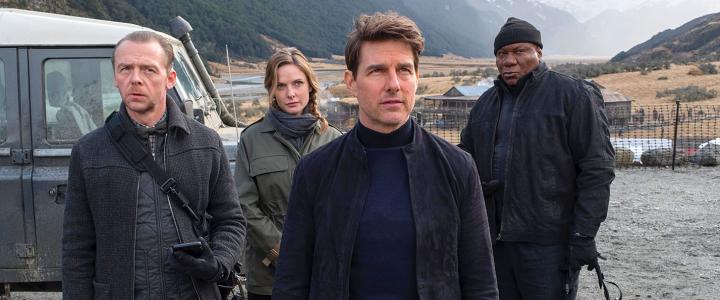
Mission: Impossible—Fallout returned to first place on the international chart with $76 million in 56 markets for totals of $205 million internationally and $330 million worldwide. The film opened in first place in both Japan and France, earning $8 million in each market. By this time next week, the film will no longer be in last place for the franchise, but it is still too soon to tell if it will become the biggest hit out of the six films.
More...
August 7th, 2018

Mission: Impossible—Fallout remained on top of the weekend box office chart thanks in part to a stronger than expected hold and in part to weaker than expected competition. Christopher Robin was the only new release to make any real noise opening in second place with $24.59 million, while The Spy Who Dumped Me opened with less than half of that. Overall, the box office earned $139 million, 11% lower than last weekend. More importantly, this was 14% higher than this weekend last year. 2018 extended its lead over 2017 to just under $600 million or 8.7% at $7.46 billion to $6.86 billion.
More...
August 1st, 2018
-1-News.jpg)
Hello Mr. Billionaire, a Chinese remake of Brewster’s Millions, opened in first place in China and the international market with $132.26 million. That’s more than 800 million in the local currency, while it took just one more day to live up to its name and reach 1 billion Yen in revenue.
More...
July 24th, 2018
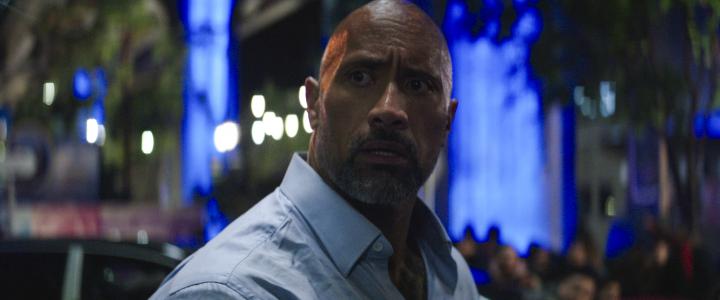
Skyscraper roared to first place on the international chart, thanks mostly to its debut in China. Overall, it earned $77.8 million in 68 markets for totals of $135.7 million internationally and $182.8 million worldwide. It opened in first place in China with $48.11 million over the weekend for a total opening of $48.51 million. The second biggest new market was Colombia, where it earned $1.38 million on 195 screens. Its best holdover was in Mexico where it was down 50% to $1.68 million on 815 screens for a two-week total of $7.46 million.
More...
July 18th, 2018
-1-News.jpg)
Dying to Survive remained in first place, both in its native China and on the international chart. It earned $69.29 million over the weekend for a total of $367.40 million after two full weeks of release.
More...
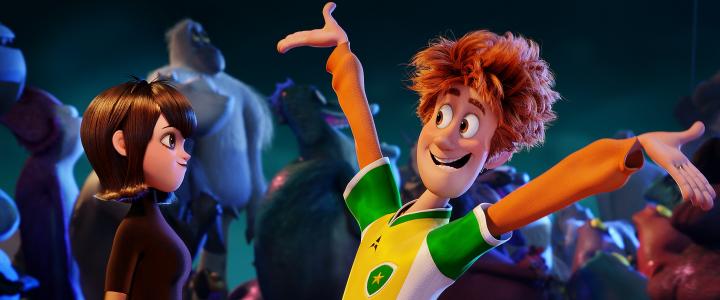
July 17th, 2018

The weekend wasn’t nearly as close as expected. Hotel Transylvania 3: Summer Vacation ran away at the box office, while fellow new release, Skyscraper, only managed third place. This did allow Ant-Man and the Wasp to earn second place during its second weekend of release. Overall, the box office fell 12% compared to last weekend, but it was 1.6% higher than the same weekend last year. Granted, this is not a high enough margin of victory to compensate for ticket price inflation, but 2018 has such a large lead that even a small victory like this is more than enough to feel good about the overall box office. Speaking of large leads, 2018’s lead over 2017 remains impressive at $550 million or 8.9% at $6.72 billion to $6.17 billion.
More...
July 12th, 2018
There should be a close race at the top of the box office this weekend, as both Hotel Transylvania 3: Summer Vacation and Skyscraper have a real shot at $40 million over the weekend. In fact, there’s a good chance both films will earn first place at least one day over the weekend. Meanwhile, Ant-Man and the Wasp will be pushed into third place, but will still be a solid box office performer. It’s this depth that is key, because the top two films from this weekend last year, War for the Planet of the Apes and Spider-Man: Homecoming, both earned more than either of the two new releases this year are expected to earn. 2018 is weak at the top, but the depth gives the weekend a great shot at coming out ahead in the year-over-year comparison.
More...
July 11th, 2018
Dying to Survive opened in its native China with a stunning $152.73 million during its opening weekend for a nine-day debut of $201.56 million—enough for it to easily win the weekend at the international box office. This film is based on the real-life story of a cancer patient who smuggled cheap drugs from India to China. Since Indian films have found an audience in China, perhaps this is another step if forging connections between those two markets.
More...
July 10th, 2018

The two biggest releases of the weekend couldn’t quite match expectations, while the two big holdovers weren’t able compensate, resulting in a rare loss for 2018. Ant-Man and the Wasp still had an excellent opening with $75.81 million over the weekend, the seventh-best opening weekend of the year. The First Purge started out well on Wednesday, but slipped below the pace needed to match predictions by the weekend. That said, the overall weekend haul was still impressive at $188 million, which is 5.8% higher than last weekend. Granted, it is 8.7% lower than the same weekend last year, but Spider-Man: Homecoming opened with $117.03 million, so this is still a good result. Furthermore, 2018 remains ahead of 2017 by a substantial amount: $570 million, or 9.6%, at $6.47 billion to $5.90 billion. If the year ended with a lead of $570 million, we would be very happy.
More...
July 8th, 2018
Ant-Man and the Wasp did not have as good a Saturday as hoped, and this has left it with a projected $76.03 million over the weekend, according to Disney’s Sunday morning estimate. While, this is more or less in line with original predictions, it is lower than previews and Friday estimates suggested. Fortunately, with great reviews and an A minus from CinemaScore, it should have legs long enough to get to $200 million domestically, with a little help from the studio. This would be a little more than a 10% increase from the first Ant-Man. Internationally, the film opened with $85 million in 41 markets, including a monster opening in South Korea. The film managed $20.9 million debut there, including previews, which was 78% higher that the first film’s opening in that market. Overall, the film saw 45% growth internationally compared to just under 33% growth here.
More...
July 7th, 2018
Ant-Man and the Wasp dominated the box office on Friday with $33.80 million. This is about $1 million less than we would have liked to have seen after its Thursday previews, but still above our earlier prediction. Its reviews are 86% positive, and it earned an A minus from CinemaScore, which is good for a blockbuster, but I was expecting an A like the original Ant-Man earned and it is below average for the MCU.
More...
July 5th, 2018

It’s technically the July 4th Weekend, although July 4th was yesterday. This is a good weekend to release a film and Ant-Man and the Wasp is looking to take advantage of the holiday. Meanwhile, The First Purge already started its run with $2.5 million in previews. Jurassic World: Fallen Kingdom and Incredibles 2 will continue to be a major presence at the box office. This weekend last year, Spider-Man: Homecoming opened with $117.03 million. There’s no way Ant-Man and the Wasp is going to match that. It’s highly unlikely Ant-Man and the Wasp and The First Purge combined will match that. The depth this year is a little better, but I think 2018 will lose in the year-over-year comparison. Hopefully it will be close.
More...
July 4th, 2018
-1-News.jpg)
Three Identical Strangers top the theater average chart with an average of $34,301 in five theaters. The only other members of the $10,000 club were wide releases, with Jurassic World: Fallen Kingdom earning an average of $13,581 and Incredibles 2 being relatively close behind with $10,525.
More...
July 4th, 2018
-3-News.jpg)
Jurassic World: Fallen Kingdom remained on top of the international chart for the fourth and final time. This past weekend, it earned $57.3 million in 68 markets for totals of $669.2 million internationally and $934.9 million worldwide. The film had no major market openings this past weekend and has no major market opening next week as well, before closing out its international run in Japan on the 13th. The film’s biggest market of the weekend was China, where it earned $14.81 million on approximately 10,000 screens over the weekend for a three-week total of $230.67 million.
More...
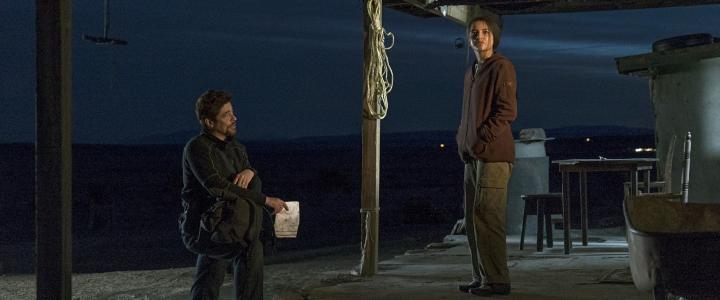
July 3rd, 2018
-2-News.jpg)
Jurassic World: Fallen Kingdom was within a rounding error of our prediction with $60.91 million over the weekend. Additionally, both new releases, Sicario: Day of the Soldado and Uncle Drew, beat expectations, as did every other film in the top five helping the overall box office reach $178 million. Granted, this weekend still plummeted 36% from last weekend, but last weekend was the biggest ever weekend in June, so falling from that figure isn’t disappointing. In fact, it is 4.8% higher than the same weekend last year, which is higher than the rate of inflation, so I would call that a significant margin. Year-to-date, 2018 has pulled in $6.15 billion, making it the fastest year to get to the $6 billion mark. This is also $560 million or 10.0% higher than the same pace last year. I’m going to make a prediction that is the the peak lead 2018 will have over 2017, at least in terms of percentage.
More...
July 1st, 2018
-1-News.jpg)
Jurassic World: Fallen Kingdom fell like a typical blockbuster hit, down 59% to $60 million over the weekend for a two-week total of $264.8 million. This matches our prediction perfectly. The film will have no trouble crossing $300 million next weekend and should finish north of $350 million domestically. As for its international numbers, it added $56.1 million to its running tally, which now sits at $667.6 million, while its worldwide total is a hair under $1 billion at $932.4 million.
More...
June 30th, 2018

Jurassic World: Fallen Kingdom added $17.44 million on Friday, after hitting $200 million on Thursday. It was easily the best film on the day; however, this was still 70% lower than its opening Friday. Granted, it will bounce back tomorrow and should come close to our $60 million prediction, but it is not going to have great legs, like its predecessor had.
More...
June 28th, 2018
After two monster hits in a row, the weekend crashes back down to Earth. Neither Sicario: Day of the Soldado nor Uncle Drew are expected to do much at the box office, but they are expected to open with similar amounts and there’s no consensus which film will do better, so at least there’s something to talk about. This weekend last year, Despicable Me 3 opened with $72.43 million. We will be relying almost entirely on holdovers to win in the year-over-year comparison. I think we’ve got an excellent shot of doing that by a significant margin.
More...
June 27th, 2018
Jurassic World: Fallen Kingdom led the way on the theater average chart with an average of $33,078, putting it ahead of Incredibles 2’s sophomore stint score of $18,219. The King was the best of the new limited releases, with an average of $14,525 in two theaters. Finally, 2001: A Space Odyssey returned to the $10,000 club with an average of $12,989. The 4K Ultra HD Combo Pack is coming out in October.
More...
June 27th, 2018
Jurassic World: Fallen Kingdom completed the hat-trick with $107.6 million in 67 markets for three-week totals of $561.5 million internationally and $709.5 million worldwide. The film’s biggest opening was in Mexico, where it earned $10.14 million over the weekend for a total opening of $12.09 million. It also did well in South America with $9.28 million during its opening in Brazil, while in neighboring Argentina, the film earned $2.51 million over the weekend for a total opening of $2.75 million. It earned $7.63 million on 734 screens during its opening in Australia. The film fell 69% in China earning $33.96 million over the weekend for a two-week total of $202.07 million.
More...
June 26th, 2018
Jurassic World: Fallen Kingdom beat expectations with $148.02 million over the weekend, but it wasn’t the only monster hit in theaters. Incredibles 2 added $80.35 million during its second weekend of release, which helped the overall box office become the biggest June weekend of all time. The overall box office rose just 2.3%, but that was enough to break the record with $277 million. This is also 98% higher than the same weekend last year. 2018 has had a string of hits that have dominated their 2017 counterparts, even if they missed expectations, so it is no surprise that 2018 has a lead over 2017 in the year-over-year comparison. However, that lead is surprisingly larger. It has grown to 9.1% or $490 million at $5.85 billion to $5.36 billion. No year has started as fast as 2018 has, and even its estimated ticket sales are the best in the 2010s.
More...
June 24th, 2018
Sequels usually start faster but fall quicker, when compared to their predecessor. However, no one expected Jurassic World: Fallen Kingdom to follow suit. In fact, many thought it would collapse. That wasn’t the case, as Fallen Kingdom opened with $150 million over the weekend. Granted, this is nearly 30% lower than Jurassic World’s opening weekend, but it could have been much worse. On the downside, its reviews are almost exactly 50% positive, which suggests weak legs. It did earn an A minus from CinemaScore, so audiences did like the film more than critics did, so we have mixed signals about what the movie will do going forward. Internationally, the film added $106.7 million over the weekend for a three-week total of $561.5 million. This includes a $12.3 million debut in Mexico.
More...
June 23rd, 2018
Despite earning mixed reviews, Jurassic World: Fallen Kingdom’s opened on Friday with $58.68 million. It also earned an A minus from CinemaScore, so audiences liked it more than critics, and that should help it over the rest of the weekend, earning about $144 million. Granted, this is significantly lower than what Jurassic World opened with, but it didn’t fall as much as anticipated, so Universal should be happy with this result.
More...
June 22nd, 2018
Jurassic World: Fallen Kingdom opened with $15.3 million in previews, which is impressive, but below the $18.5 million Jurassic World managed. There is further bad news. The film’s reviews are significantly worse than its predecessor’s reviews were. The film also has much stronger competition. That said, it is still in a good position to top our prediction. We will know more by this time tomorrow.
More...
June 21st, 2018
Jurassic World: Fallen Kingdom is the only wide release of the week and it was expected to dominate the box office. That was until Incredibles 2 broke records last weekend. Furthermore, Fallen Kingdom’s reviews have fallen below the overall positive level. Now there might be a race at the box office, at least on the daily charts. Meanwhile, this weekend last year, Transformers: The Last Knight missed expectations with just $45 million over the weekend and $70 million in five days. Fallen Kingdom had better earn $45 million on Friday alone, or it is in serious trouble.
More...
June 19th, 2018
Jurassic World: Fallen Kingdom remained in first place with $173.6 million in 51 markets for a two-week total of $370.0 million worldwide. It opened in first place in China with $111.31 million over the weekend, for a total opening of $113.42 million. This is better than the $100.10 million opening Jurassic World managed in that market. While this is good news, there are some issues. The film suffered an average of 60% decline in holdover markets. This includes a 63% decline in South Korea ($5.44 million on 1,230 screens over the weekend for a two-week total of $37.74 million.) and in Russia ($2.78 million on 1,541 screens for a running tally of $15.16 million there.) It did hold on better in the United Kingdom, down 51% to $9.38 million in 656 theaters for a total of $33.75 million so far. The film has yet to open in Australia, Brazil, and Mexico, where it opens this weekend. Meanwhile, the film doesn’t open in Japan till next month.
More...
June 18th, 2018
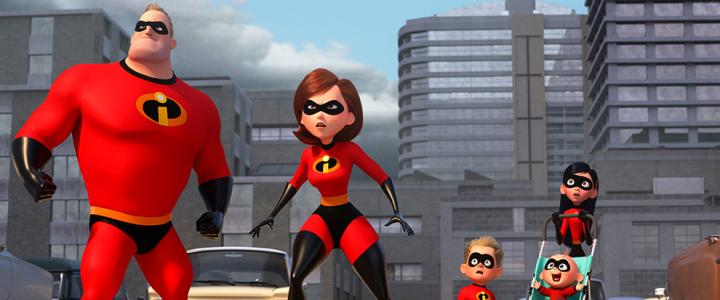
Incredibles 2 became the first potential monster hit since Infinity War to beat tracking numbers, opening with a mind-numbing $182.69 million. It is hard to describe how amazing this opening is. It has rewritten the record book when it comes to animated films and it gives Disney the top three openings of 2018 and four of the top five. This is twice as much as the rest of the box office earned over the entire weekend. There were other new releases this week, with Tag doing fine. Its $14.95 million opening is nothing special, but it should break even sometime on the home market. SuperFly, on the other hand, was a disappointment. The overall box office grew by 126% from last weekend, with Incredibles 2 earning about 50% more than the entire box office pulled in last weekend. The film was just shy of the same weekend last year, while the overall box office rose by 43%. Year-to-date, 2018 continues to have a lead over 2017, and it has grown to a commanding lead of 6.6% or $340 million at $5.44 billion to $5.10 billion. Granted, we are barely halfway through the year, but 2018 is in a great position to break the all-time yearly box office record.
More...
June 17th, 2018
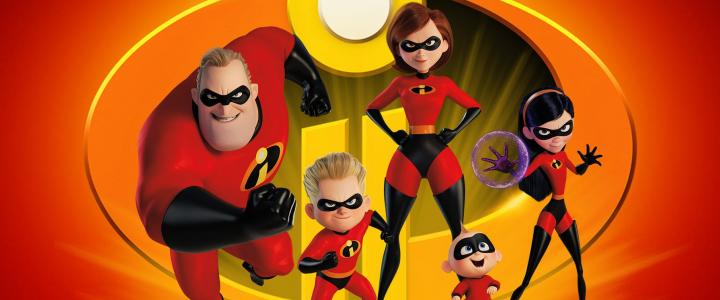
Incredibles 2 was widely expected to dominate the box office over the weekend, but after the two previous potential monster hits missed high expectations, I thought it was wise to be a little more pessimistic. I was wrong. Incredibles 2 opened with an estimated $180 million. This is not only the best opening for a Pixar film, and an animated film in general, it is the 8th biggest opening weekend of all time. (It could slip a little in tomorrow’s final numbers, putting it in 9th place behind Captain America: Civil War.) The film is already the 50th biggest animated hit of all time and unless its legs are shorter than expected, it will quickly race to the top of that chart. Speaking of legs, Incredibles 2 has the best reviews in the top ten and earned a stunning A plus from CinemaScore. To be frank, perhaps stunning isn’t the right word. Perhaps “expected” is a better term, as Pixar has earned 7 A plus ratings out of its 20 films and has never once slipped below an A minus. Internationally, the film opened in second place with $51.5 million in 25 markets and earned a Pixar-best opening in Mexico ($12.3 million) and Argentina ($3.0 million). In fact, it was outstanding in all of Latin America. It is also the fasting opening Pixar film in Australia with $7.7 million, while it managed the studio’s second biggest opening in Russia with $5.4 million. Granted, the film is not doing as well internationally as it is domestically; however, it is still on pace for $1 billion worldwide, so there’s no way the studio isn’t celebrating this opening.
More...
June 12th, 2018
Jurassic World: Fallen Kingdom opened in first place on the international chart with $150.9 million in 48 markets. The film’s biggest market was South Korea, where it set the opening day record with $9.7 million, but its overall weekend was not quite as impressive, as it earned $15.17 million for a total opening of $26.57 million. That three-day total is better than Jurassic World, but its a drop from the opening day to its weekend total. This could be a sign of weak word-of-mouth and that’s troubling as its reviews have slipped below the overall positive level. The film also cracked $10 million in both the U.K. ($19.20 million in 662 theaters) and in France ($10.91 million in 700), but this is lower than the predecessor managed in both those markets. Overall, the film will have little trouble earning $1 billion worldwide, but it very likely won’t live up to Jurassic World.
More...
June 1st, 2018
This May was an odd month, as Avengers: Infinity War opened on the last weekend of April, rather than the first weekend of May. This meant May started out slowly, but Deadpool 2 and Solo: A Star Wars Story did well enough to give 2018 a healthy lead over 2017. Looking forward, there are two potential monster hits this month, Incredibles 2 and Jurassic World: Fallen Kingdom, and another $100 million hit, Ocean’s 8. Last June, there were four $100 million hits, led by Wonder Woman, which pulled in over $400 million. I think 2018 and 2017 will be an even match at the top, so 2018 will have to rely on depth to improve upon its lead over 2017.
More...
December 7th, 2017
Sci-fi action movie starring Chris Pratt and Bryce Dallas Howard opens June 22 ... Full Movie Details.
More...
.jpg)